Author: Paul Orlando

  • Running a “Why Now” Session

    If you’re finding this post now, I actually wrote a book about all this… It’s called Why Now: How Good Timing Makes Great Products. You’ll get a fuller perspective there.

    This is a format I developed and have run with startups in incubators and accelerators, grad students, and other groups. The goal is to understand how timing may benefit a specific business or product and then how to express that. I use something that I call a Timing Map to help organize the information and understand its impact.

    This entire exercise can be done in a few ways. Regardless of how much time you take for the steps, I recommend each step in the following order. I also included suggested time allotments and team member involvement. This is based on what has worked for me and the groups I’ve guided.

    For background, see earlier posts on Timing and Product Success, Timing Drivers Visualized, and Avoid the Analysis of Others.

    Why Now Session Steps

    1. Form the team for the Why Now Session. That’s the founders for early-stage startups, CXOs for later-stage, and the product team for larger entities. 
    2. Form the team for the “Challenge Session.” These are the people who will pick apart your reasoning. The team could be made up of colleagues and friends for early-stage startups, colleagues across the organization and outside the organization for later-stage startups, and product leaders for larger entities. (I’ll cover the Challenge Session in a later post.)
    3. Run the Why Now Session (advance preparation plus 1 – 2 hours of live meeting time). 
    4. Share findings with the Challenge Team. This can be either live (15 minutes) or sent in advance for individual review.
    5. Challenge Team session. Present and take questions (1 hour total, with only 15 minutes needed for presenting and the rest of the time spent on questions).

    Run the Why Now Session

    1. Go through the list of drivers from the earlier posts. Which drivers are most important to your business now? Make a list of them. 

    If you end up with a long list, narrow down to the most important ones. Start to list the information relevant to your Why Now, including dates.

    What relevant history should you know about? What earlier attempts were there at similar products?

    What future expectations do you have? What will change because of the drivers you identified?

    Most Relevant Drivers

    Relevant History (Make a list of earlier attempts that didn’t work and why. Or earlier attempts that did work, but in a limited or different way. Include dates.)

    Future expectations (Depends on driver type and expected speed of change. Include expected dates.)

    “Driver 1”


    “Driver 2”


    “Driver 3”


    2. Draw your own rough diagrams based on the drivers, using the ones below as examples. Since your situation probably includes multiple drivers, draw these however it’s most helpful to tell the story of what is changing. To keep your work readable, create a separate diagram for each driver.

    • For example, if your Why Now depends on a new technology becoming faster and cheaper, what’s the expected timeline for that? 
    • For example, if your Why Now depends on a new social/behavioral norm, when did it become a noticeable niche? When might that norm become mainstream, if it hasn’t already?

    3. Build the Timing Maps. Put each driver on its own timeline and show examples of the changes. You might show some distinct changes like this. Choose to put “today” at a spot that gives you enough room for the earlier examples. It’s OK if different charts have different total years of past history shown.

    4. Related to the above, if you have a continuous change, rather than individual examples, you might show that change like this.

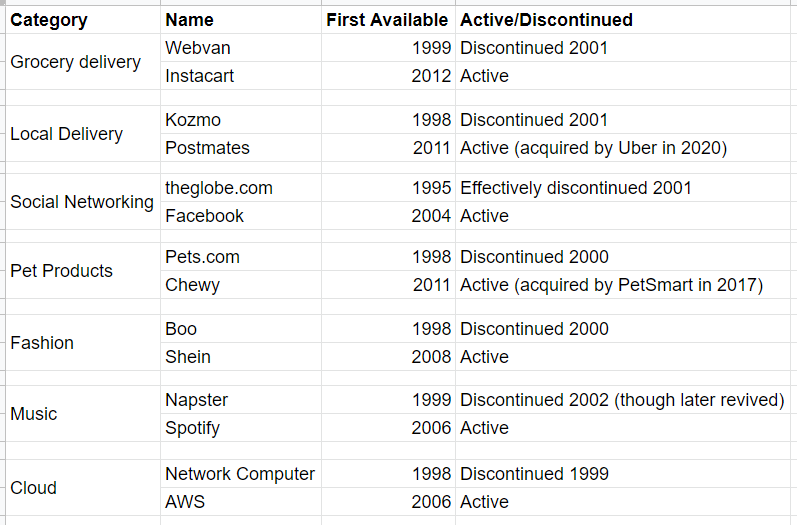
    5. If you have examples of earlier companies that tried similar ideas, place them on a timeline. What happened to them? Did they fail because of bad timing?

    6. If there are current companies building similar solutions, place them on another timeline. Again, choose where to put “today” so that you have enough room for the examples.

    7. Now that you have done the above, mark these next points on your timelines: 

    • The latest point at which you believe you would still be so early that your business would fail mainly because of timing. When were the drivers too weak to matter? 
    • You can also draw a second line where you feel the market window will close based on how fast things are changing. This is where you expect other companies will dominate the industry if you don’t act. Being too late may be less of a problem than being too early.

    Drivers may operate on different timelines. You’ll see below that I break them out separately and then stack them up to show the overall picture.

    Also, some of these diagrams are loosely defined. When you do this exercise, it’s going to show your perspective, not a single true or false answer. You do however need to back up your perspective with data.

    After this exercise, you can present all of this detail in a single slide when you pitch for investment or present your company. But the result of this exercise is that when you do speak about your business and its timing benefits, you’ll be able to have a much deeper discussion about your perspective.

    Here’s an example with a large, successful company to gain more familiarity with the process. 

    Case Study: YouTube’s Why Now

    Whenever I read about a process, I wish there were examples to help take me through them. I feel like I only really understand what to do once I see it in action. So if you’re like me in that respect, this next section is for you.

    Let’s take YouTube, which was launched as a startup in 2005, to demonstrate the above technique.

    Why was YouTube’s timing great? It might be hard to think back to why. 

    We take for granted that we can find and stream a video of just about anything today. That wasn’t always the case. What drivers impacted YouTube’s launch?

    The following info is from both the Viacom Vs Google (YouTube) lawsuit that exposed Sequoia’s investment memo and other research on the companies and technologies mentioned.

    1. Scanning the list of timing drivers, these look like the most important for YouTube.

    Most Relevant Drivers

    Relevant History (Make a list of earlier attempts that didn’t work and why. Or earlier attempts that did work, but in a limited or different way. Include dates.)

    Future expectations (Depends on driver type and expected speed of change. Include expected dates.)

    Technology: Moore’s Law

    Falling cost of data storage needed for video files. Cost of storage for typical short videos (only 7 Megs at the time) was much less than $0.01 in 2005.

    Expected to continue to decline. Data storage cost projections are available.

    Technology: Edholm’s Law

    Increasing data speeds for streaming large video files. By 2005 it’s already common for people to have broadband in the home. Broadband to the home grew at over 30% per year in the lead up to 2005, with approximately 30% of US households having broadband by 2005. Cost of bandwidth for typical short video files was much less than $0.01 in 2005.

    Expected to continue to decline. Projected along Edholm’s Law curve.

    Social/Behavioral

    More people comfortable with sharing images and videos and videoing themselves. 

    Relevant acquisitions: Picasa (digital photo organizing service launched in 2002) was acquired by Google in 2004, Snapfish (online photo sharing and printing) was acquired by HP in 2005, and Flickr (photo sharing site launched in early 2004) was acquired by Yahoo! in 2005.

    Expected to continue. People will not stop sharing online as it becomes easier to do so. People already sharing images will start to share video.

    Social/Behavioral

    Social networking sites like MySpace, Friendster, LinkedIn, and Facebook launched in 2003 and 2004 and are growing in popularity.

    Expected to continue. These social networking sites will drive both supply and demand of online video.

    Installed Base

    Webcams connected to a computer became common with sales in the tens of millions of units sold by 2005.

    Expected to become more popular as they become cheaper and better. 

    Installed Base

    Digital camera (can be carried around and then connected to a computer to upload files) unit shipments were approximately 60M in 2004 and 65M in 2005, globally.

    Expected to become more popular as they become cheaper and better.

    Regulatory/Legal

    Problems distributing copyrighted content. Avoid the issues in the beginning, with the understanding that a solution will be needed eventually. 

    YouTube did have to deal with pirated copyrighted content later, but since the company focused on user generated content, this area is unimportant for the Why Now analysis.

    Not a top driver of timing.

    2. Draw diagrams for the above list. 

    • If any of these stopped growing, which would have the biggest impact on YouTube?
    • Draw projections (dashed lines) based on industry reports and the likelihood that the trend would continue. 
    • Input your own perspective as well.

    3. Now let’s look at why earlier attempts partially succeeded or failed. What has changed since then?

    Earlier attempts at video streaming include:

    • The band Severe Tire Damage played the first Internet concert in 1993. This was broadcast live at Xerox PARC with video and audio carried over the highspeed MBONE (IP Multicast Backbone) and using a significant amount of all Internet bandwidth available. The band then opened for The Rolling Stones in another online show in 1994. Sound and video quality was poor.
    • Real Networks RealVideo Player (1997) could stream video and vary the number of frames per second depending on connection and computer processing power. 
    • Blockbuster / Enron Broadband Services (2000, not launched) focused on the distribution of existing copyrighted content. Required a TV and a device.
    • Hong Kong Telecom iTV (1998 to 2002) required TV, a set top box, and high-speed Internet. Users experienced long delays when trying to load videos and little content to choose from. 
    • Shareyourworld.com (1998 – 2001) enabled users to upload and share their own videos. The company was without a revenue model and had bandwidth problems, but benefitted from cameras becoming cheaper. 

    4. Competitors. Now add the recent companies (in 2005) delivering similar services. 

    • PutFile launched early 2004. Provided video hosting, with ratings.
    • Vimeo launched in late 2004. Some problems with the technology, owned by CollegeHumor, which helped with distribution.
    • Google Video launched early 2005. Targeted existing content, rather than user generated content.
    • 24 Hour Laundry (24HL) launched in 2005. Focused on video hosting and blogging.
    • Dailymotion launched in 2005. 
    • Other video companies focused on adult content and were unlikely to move to the mainstream market. I’m not counting them in the list.

    5. Build the Timing Maps. Make diagrams of the main drivers. For each chart I marked Too Early (dotted vertical line). In the competitor chart I marked the opportunity bracket (the space between Too Early and estimates for when the market window will close, shown by the other dotted line at the right). Today (the year 2005) is shown in bold.

    YouTube also made good decisions. Helping with distribution, YouTube transcoded different video file formats to compressed Flash video, the most common format at the time. Other video companies of YouTube’s era made tactical errors, had poor management, or didn’t improve their slow video load time. Those examples are important, but aren’t included in the Why Now Session, except as additional context.

    Depending on who you present to, you might not want to share all the details that came out of your Why Now Session. As a summary, put your findings in a readable single slide when you pitch for investment or present your company. The result of this exercise is that when you do speak about your business and its timing benefits, you’ll be able to have a much deeper discussion about your perspective. If desirable, you can also share the extra content in a more detailed presentation.

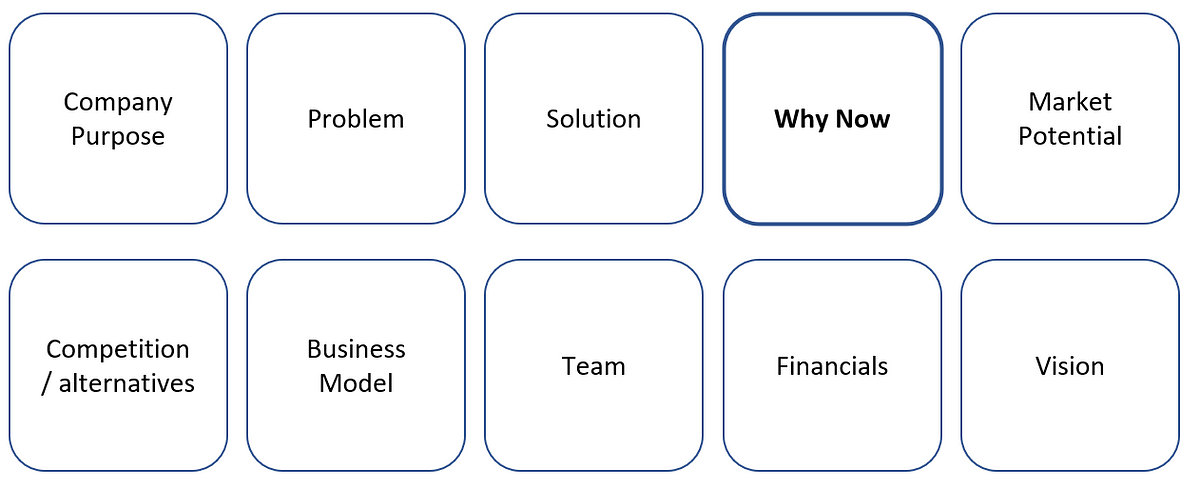
    Now that we’ve done YouTube’s Why Now Session, what would a summary slide look like? Here’s my version.

    When you compare this slide with all the detail in the above sections you can see that I chose not to include every detail. After all, when you present your Why Now slide you’re getting into a discussion, not putting every piece of supporting detail on one page. But with the more detailed work above, you will be able to discuss each of the slide’s bullet points in detail. Skip the above steps and you’ll risk a superficial understanding of your timing advantage. By going through the above process you’ll also have the content for a more detailed version that you might want to share with some audiences, such as your Challengers.

    Feel free to say hello here or at @porlando on Twitter. I hold “Why Now” workshops periodically. Contact me to learn about the next one.

    Here’s the list of other Why Now posts. If you like these, check out the Why Now book.

  • Avoid the Analysis of Others (Why Now)

    If you’re finding this post now, I actually wrote a book about all this… It’s called Why Now: How Good Timing Makes Great Products. You’ll get a fuller perspective there.

    This is another in the Why Now series. You might also like to read these posts: Why Now: Timing and Product Success and Timing Drivers Visualized.

    In the timing or “Why Now” research I’ve been writing about I do ask you to know about existing and forecasted demand for related products. But this is different from looking at research that predicts demand for your own product. 

    In your supporting research, you should look at what’s changing in drivers that support your business arriving at the right time. Look at the converging factors that make this the right time for a product to exist. (Of course, you might find that there are no drivers in your case.) 

    But sometimes people are tempted to look at the timing question in an unhelpful way.

    One tempting approach when running a Why Now Session is to look up analyst reports of future demand for your product, choose the big numbers, and use that to support your case.

    Don’t do that. Here’s why. 

    Below is a series of analyst estimates from 2016 for the potential size the virtual reality and augmented reality market would reach in a few years. I chose 2016 since VR and AR received a lot of attention then. That was the year many people expected the technologies to break out. 

    • “[T]he market for VR products and technologies was valued at $1.37 billion in 2015 and is expected to reach $33.9 billion by 2022. The overall market for AR was valued at $2.35 billion in 2015 and is expected to reach $117.4 billion by 2022.” [MarketResearch.com]
    • “The virtual and augmented reality market will reach $162 billion by 2020.” [Business Insider]
    • “Forrester’s report estimated the demand for virtual reality headsets in the U.S. will mean there’ll be 52 million devices in the country by 2020.” [CNBC]
    • “According to the report, the global virtual reality (VR) market was valued at approximately USD 2.02 billion in 2016 and is expected to reach approximately USD 26.89 billion by 2022, growing at a CAGR of around 54.01% between 2017 and 2022.” [Globe Newswire]

    The above reports were from 2016. Now let’s look at reports published in 2020 about the actual current state of VR and AR.

    • “The global virtual reality software and hardware market size was valued at $2.6 billion in 2020, which will jump to $3.7 billion in 2021, $4.6 billion in 2022, and 5.1 billion by 2023 (SuperData, 2020). As of 2020, 26 million VR headsets are owned by consumers globally (CNBC, 2020). The combined augmented reality and virtual reality markets were worth $12 billion in 2020 with a massive annual growth rate of 54%, resulting in a projected valuation of $72.8 billion by 2024 (IDC, 2020).” [Finances Online]
    • “The global virtual reality market is projected to grow from $6.30 billion in 2021 to $84.09 billion in 2028 at a CAGR of 44.8% in the forecast period, 2021-2028.” [Fortune Business Insights]
    • 5.5 million VR and AR devices were shipped globally in 2020. [IDC]

    What wildly different outcomes in just four years! The expectations from 2016 were much higher than what reality served up in 2022.

    My point isn’t to pick on VR and AR market analysts. There have been many industries that seemed promising and ready for fast growth that later fell short of expectations. Instead, my point is that if you’re using other people’s forecasts to justify your own timing, you’re skipping the process and just looking for big numbers to legitimize what you’ve decided to do anyway.

    You are also missing the point of thinking about timing and running a Why Now Session. You need to approach the Why Now Session from the perspective of learning about drivers that support your business, not by simply choosing research that agrees with you.

    Plus, if you just repeat analyst quotes, when you meet someone who doubts the numbers, the best response you can give is “that’s what they say.”

    But why were the analyst reports wrong?

    It’s hard to know without seeing their process, but I suspect something other than methodology as the prime cause. 

    What gets reported and repeated are the big numbers, the big potential opportunities, the stories for how the world will be different in the near future. Teams seeking investment and even investors seeking justification for their investments will be tempted to stress the optimistic outlooks. So will analysts. It’s more noteworthy to publish research claiming a big change is on the way, rather than research saying that the world will remain the same.

    Avoid copying analyst research outright and focus on understanding timing drivers and their impact on your business.

    If you’re presenting your own Why Now, relying on analyst reports without understanding the underlying drivers opens you up to being challenged by someone who doesn’t believe the reports. Instead, if you present your reasoning behind the way drivers will affect outcomes and the timing for that, you’ll have a discussion.

    I’ve done a YouTube timing analysis from the perspective of 2005. In that case I did use analyst reports on the number of projections, including on digital cameras and webcam sales, how broadband penetration was going to grow, and on the cost of file storage. I also showed what people had already done, such as the number of cameras purchased and social media and online image sharing that was already taking place.

    But there were a couple differences in the YouTube research I used and the VR / AR examples I showed above.

    For some of the research I showed, the world had already reached the point where enough supporting drivers were in place. File storage was already cheap, even if it was declining in cost predictably. Broadband penetration to the home was already becoming common and people were not about to go back to dial-up. Digital cameras and webcams were already becoming common and the idea that people would go back to videocassettes was unlikely.

    The supporting drivers were already in place and demand for video was already there.

    That list is different from the VR / AR projections for units shipped, which made projections on what people would start to do in the future. 

    If you’re evaluating someone’s Why Now and you question them using a set of analyst reports you trust, make sure you understand the drivers of the expected changes. 

    If you’re evaluating someone’s Why Now and you instead see a reliance on analyst reports, talk through their logic.

    If someone pushes back on your Why Now with an analyst report that they trust, ask how the analyst came to their conclusions. Is the disagreement on how fast the change will happen or on its magnitude? Is there an appreciation for the way multiple drivers may converge?

    Simply reporting that a changing industry will be a certain size by a specific date doesn’t give you much useful information.

    Feel free to say hello here or at @porlando on Twitter. I hold “Why Now” workshops periodically. Contact me to learn about the next one.

    Here’s the list of other Why Now posts. If you like these, check out the Why Now book.

  • Timing Drivers Visualized (the Why Now question part 2)

    If you’re finding this post now, I actually wrote a book about all this… It’s called Why Now: How Good Timing Makes Great Products. You’ll get a fuller perspective there.

    In the previous post on Why Now: Timing and Product Success I introduced 12 timing drivers. That list of drivers was Technological, Social/Behavioral, Regulatory/Legal, Installed Base, Economic, Networks, Distribution, Capital Access, Organizational, Available Talent, Demographic, and Crisis.

    These are the drivers that help you determine if what you are building is going to hit the market at the right time. 

    To get a better feel for them, I like to visualize the way those drivers behave. Here they are with some simple diagrams that explain more about how they work.

    And this is part art, part science. I’m writing this series because as important as the Why Now question is, I haven’t seen many people dive into the question deeply. I’m trying to do that over a series of posts and workshops.

    Select from this list and add to it depending on your situation.

    Technology drivers change what you can build. What was too slow, too expensive, or impossible becomes fast, cheap, and possible. Here are a couple examples.

    Economic drivers reflect changes in the economy you operate in. They are usually not smooth changes – at least not for long. Shocks are common. 

    Regulatory and legal drivers describe the way businesses are prohibited or required because of governmental decisions. Some types of businesses and products are strongly prohibited, only to be allowed later on. Sometimes those prohibitions or requirements operated cleanly – like an on/off switch. And sometimes there’s a lot of flexibility. In those cases, regulatory/legal drivers are more like a dimmer switch.

    In some cases, there is predictability to these changes. An example of clean predictability is when something is patented, allowing the patent holder to commercialize it while preventing others. But patents are for a limited number of years. Some industries only grow when key patents expire.

    Less predictable changes include new legislation that is influenced by public interest groups or lobbyists, changing public opinion, and elections that affect who votes on rules.

    As for the dimmer switch, some rules are just loosely enforced. 

    Social and behavioral drivers can offer surprises. 

    There are enduring human needs that seem like they’ll never go away, as long as there are people. A short list would include love of music and entertainment and the need for housing and food.

    There are also habits that emerge or are promoted. Over the centuries, people started drinking coffee and tea – old products that have been commercialized in increasingly more ways. People also started to drink alcohol in many forms, sometimes commonly in the evening and at other times and places in history, from breakfast until dinner. What determines those changes?

    Installed Base drivers rely on the existence of another product that the new business will ride on top of. 

    Devices in use may perform a vital function that enables something new. 

    Different from Installed Base, Network drivers create opportunities through their connections. 

    Network drivers are affected by the number of nodes, connections between them, and how communication flows.

    Organizational drivers are about the way people organize themselves and resources. Innovations in these drivers affect what can be built and how.

    New types of Distribution, both physical and digital, make new businesses possible. 

    What Available Talent is there to support the building of specific products? What will these people need as they take new roles?

    Demographic Drivers describe the way populations change over time. Some changes are predictable in advance (you need 25 years to grow a new group of 25 year olds). And some change over time.

    Capital Access changes over time with the economy, interest rates, evidence of success stories, and other trends. 

    And whatever the situation, a Crisis can change things quickly. Crises can change the speed and direction of processes and result in unexpected outcomes.

    These are examples. Your experience may not be described above. But you can use the categories to explore which drivers impact your business and what specifics you see in each.

    Feel free to say hello here or at @porlando on Twitter. I hold “Why Now” workshops periodically. Contact me to learn about the next one.

  • Why Now: Timing and Product Success

    If you’re finding this post now, I actually wrote a book about all this… It’s called Why Now: How Good Timing Makes Great Products. You’ll get a fuller perspective there.

    Deciding what product to build depends on many things. The problem you’re trying to solve, your capabilities, what you’re passionate about, people involved, how much time you have, your budget, and even temporary considerations like what’s currently hot and how easy it is to raise money.

    You have similar questions if you’re evaluating startups as potential investments. Or if you’re a startup founder or an early team member. Or even if you’re part of a team in a larger organization developing new products in-house.

    Many things influence your likelihood of success, but there is one factor we recognize, while often not really diving into how it works. That’s the importance of timing, or the “why now” question.

    This question has become common in the startup world, but is relevant in many situations.

    Forms of the Question

    Depending on your focus, the Why Now question itself can take different forms.

    • “Why is this the right time to build this business?” In other words, what bigger forces support this type of business being a success?
    • “Does the market environment give this business an advantage?” Or: What is the mix of potential customers and potential businesses serving those customers? How does that environment give this business an advantage or disadvantage?
    • “Should I wait?” As an investor or early employee, should I wait to see how things develop before going in? Do I risk being too early if I invest or join now? Are early companies at an advantage or a disadvantage?

    These questions look simple. But as with many simple questions, there’s a lot going on.

    It takes a while to uncover answers to these questions. Over the last couple years I’ve written a menu of options and a set of recommendations to put them into action. I supplemented that with a range of examples I now dip into for comparison to different situations.

    Here’s a basic visualization to the way I think about timing and products:

    Over the years I’ve seen a lot of change in the way people build startups.

    Years ago it was rare to see startup founders systematically go out to learn from their potential customers before building a product. And then, once those same founders learned a bit, it was also rare to see them build something minimal to test and learn if they were on the right track, before committing to build even more. Thanks to books like Four Steps to the Epiphany, The Lean Startup, and Business Model Innovation, methodologies like customer development and concepts like the minimum viable product, lots of off-the-shelf tools and entrepreneurial education, many people changed the way they learn from customers and build products.

    It’s time we do the same for the questions of market timing.

    This is for you if:

    • You’re a startup founder, working to understand how your company may be at an advantage because of market timing. How could you use timing to your advantage? How should you highlight that advantage when raising funding? How about when presenting how big and fast your business could grow when hiring talent?
    • You’re part of a product team within a larger organization. What timing considerations should guide your new product development? How could you use an evaluation of timing to help acquire a budget and generate internal support for your work?
    • You’re a potential early hire and want to join people working on strong opportunities. If you join industries and companies with a good chance to grow, your own opportunities will grow too. Apart from the team, role, and compensation, what else should you look for?
    • You invest and want to focus your system for evaluating opportunities. You’re looking for a new framework and examples to pattern match against.

    Since the title might confuse, I wanted to also mention what this post is not about.

    This is not about why you personally should found or join a company. People are different and everyone has their own situation. The “why now” I reference is not about finding your passion or life meaning.

    But if you want to understand the way timing impacts company and product success, you’re the person I wrote this for. Determine if the time is right for your business to exist.

    The reason I’m in a good place to write this is that I’ve started businesses that were both too early (not much fun) and then at exactly the right time (much more fun). I’ve built and operated four startup accelerators and incubators around the world and have seen many startups struggle with (or often ignore) questions of timing. I’ve taught entrepreneurship classes at a major university with a large entrepreneurship center (the University of Southern California). I’ve brought the timing question into the mix as a hands-on workshop for startups and grad students. I’ve also presented publicly about this topic many times while putting my thoughts together.

    How Others Think About the Why Now Question

    An environment or emerging trend may create a situation that a team can use to its advantage. The same team, working on the same business or product, may have had a harder time earlier when that environment was different and when those trends hadn’t yet emerged. And some companies, already in operation but struggling, benefit from timing in that they were coincidentally ready to take advantage of a new opportunity.

    As investor and Netscape founder Marc Andreesen said: “Track startups over multiple decades, what you find is that most ideas do end up working. It’s much more a question of ‘when’ not ‘if’…”

    Just look at a very partial list of Dotcom era startups that failed, paired with the related successes that came later. Andreesen’s comment seems to hold. The ideas themselves weren’t bad if others eventually went on to succeed at building them.

    A very limited list of failed Dotcoms and later comparables

    Or is Andreesen’s comment specific to new tech companies? Do others focus on timing in history?

    Let’s ground ourselves by going back a couple centuries to Napoleon Bonaparte — someone who upended entire governments in Europe. You’d think Napoleon would believe that he could do whatever he wanted, whenever he wanted, through force. And yet, when it came to the importance of timing he said:

    “I never was truly my own master; but was always controlled by circumstances.”

    And we also have the popular approach to this. The most famous scene in the movie The Graduate is this one:

    Mr. McGuire: ”I want to say one word to you. Just one word.”

    Benjamin: ”Yes, sir.”

    Mr. McGuire: ”Are you listening?”

    Benjamin: ”Yes, I am.”

    Mr. McGuire: ”Plastics.”

    Benjamin: ”Exactly how do you mean?”

    Mr. McGuire: ”There’s a great future in plastics. Think about it. Will you think about it?”

    We laugh at that scene, but the thing is… McGuire was right. And he was talking about timing.

    The plastics industry went on to grow at a tremendous rate after his comment. If you were a young college graduate at the time, as Benjamin was, you could have built a company or a career in the plastics industry.

    Note that McGuire didn’t say “go work for DuPont,” or “you should join Dow Chemical.” He said “plastics” and then let Benjamin sort out his path forward (which ended up not involving plastics at all).

    So I’m modifying Andreesen, Napoleon, and McGuire’s comments to the simple:

    Understanding timing in your market is essential. When teams don’t ask ‘why now’ they miss opportunities to be more successful and risk setting themselves up for failure.

    So how do you identify your Why Now?

    Why Now Drivers

    The first way I look at the Why Now question is to identify the main drivers of market timing that impact a given business.

    Your Why Now is a perspective on how one or more of these drivers impacts your odds of success.

    There are many drivers of Why Now advantages. And yes, they can overlap.

    This is a summary list of drivers I focus on:

    1. Technological. These drivers come from tech that improves the ability to build specific products. What was too slow, too expensive, or impossible becomes fast, cheap, or possible. Some types of incremental tech progress is predictable on a rough timeline while other radical types are not. There are “laws” like Moore’s Law and more that describe how fast we may see these changes. Think of the computing power changes in the past few decades.
    2. Social/Behavioral. Some behaviors seem to be as enduring as humanity itself (say, the love of music). Some practices go from being scandalous to normal or uncommon to common. Some behaviors originate in one part of the world and then spread elsewhere. And some industries are built on addictions that had to be developed, for example, caffeine, tobacco, and other drugs, but also news media and entertainment. Think of the way cigarette smoking declined in the US after decades of growth. After the decline, the habit may be replaced by something else, like vaping. Some behaviors, once accepted as the norm, receive new scrutiny.
    3. Regulatory/Legal. This affects whether businesses are allowed to produce specific products. When regulations or laws are created or lifted, strengthened or weakened, answers to the why now question also change. Some companies follow regulations, some avoid them, and some fight them. Regulatory and legal drivers can function like on-off switches or dimmer switches. The cannabis industry, which operated in a gray market for the last century, has been coming into the mainstream as a result of changed regulations. New financial instruments like cryptocurrencies can go from unknown, to encouraged, to outlawed. Popular businesses can also influence regulations and laws, for example as Airbnb did for hotel licenses. Much telecom innovation came from avoiding regulatory restrictions.
    4. Installed Base. This is a term I use to describe the way some businesses depend on the existing popularity of something else. For example, while the components that supported rideshare (GPS, handheld communications tech, online payments, rating systems) were already established it took years until smartphone penetration and the app stores combined them all. Building Lyft and Uber before then would have been technically possible, but much more difficult. The earlier installed base of Garmin and TomTom GPS devices in cars did not enable ridesharing, because the devices were only used in cars and not by passengers waiting for pickup, couldn’t handle payments or ratings, among other limitations.
    5. Networks. This is different from the above in that the connections are key, rather than the deployed equipment. The network may also rely on different supporting infrastructure than the equipment. For example, the existence of online social networks that enabled new forms of content distribution, selling, and subscription models. The connections were the key, rather than the equipment people used. Traditional networks of people enabled trust at a distance and new forms of commerce.
    6. Economic. Why Nows of this type rely on changes in economic factors. For example, a group of people may have become wealthier (or poorer) and as a result a company’s market may change. A new business model may become possible or an existing business model may become possible in a new place. Economic change may be predictable enough to build businesses with that change in mind. Interest rates (low or high) change behavior.
    7. Distribution. New forms of distribution enable some types of business. For example, the printing press in Europe led to cheaper books, more of them, and spreading of the ideas that led to the Protestant Reformation where earlier religious movements failed or were more limited in growth. Online communities form a new kind of distribution opportunity to tap into. Distribution may come from a combination of other drivers, but functions as its own driver.
    8. Capital Access. Capital access varies at different times and locations. Who is the likely source of capital — government, venture investors, traditional lenders, customers, or communities? What impact do low or high interest rates have on willingness to invest in spite of risk?
    9. Organizational. New organizational structures, including corporations (so individuals may be shielded from the risk the organization takes) and decentralized autonomous organizations (DAOs) for trustless accountability. Businesses may be able to produce more cheaply or without fixed costs by outsourcing production or operating at scale.
    10. Available Talent. The production of new experts in specialist fields such as AI, medicine, entrepreneurship, and more. How fast is that talent produced and what access is there, whether in a geographic area, or online? Can you access the talent?
    11. Demographic. A population shift that changes prospects for the business or product. Population shifts are usually slow, studied, and predictable. The exception to that is smaller sudden shifts from immigration, war, refugees, and pandemics. What population segments experience at different times and how that affects them long-term.
    12. Crisis. A sudden change that opens up an opportunity where none existed before. Examples include the sudden increase in remote work, deliveries, ecommerce, telemedicine, and more during COVID.

    This list of Why Now Drivers will help you think about when to attack a changing, or unchanging, world, existing customer demands, and problems to be solved.

    Investors and Why Now

    There is a difference between stories presented in a pitch deck and real experience. But when it comes to why now questions, pitch decks are one common place you see them answered.

    For example, VC firm Sequoia has a recommended slide order for startup founders pitching to them (shown below). Likewise, DocSend (a company that enables founders to track who reads their pitch decks) has published a similar observed slide order. In both cases, a Why Now slide features in the first half of the pitch deck.

    But thinking about timing is not just for your PowerPoint slides. It’s also part of your own strategy.

    In the paper “How Do VCs Make Decisions?,” the authors surveyed over 800 VCs at over 600 firms to ask about their top considerations for making investments.

    More than 60% of responding VCs considered market timing an important factor that contributed to successful investments (differences in rate depending on company stage) and approximately 10% considered timing to be the most important factor. For failed investments, timing was also listed as an important factor by more than 40% of VCs, with roughly 10% of VCs naming timing as the most important reason for the failure.

    In his book Zero to One, Peter Thiel, Facebook’s first investor, listed seven questions for startups, including a timing question: “Is now the right time to start this particular business?” Thiel compared social networking and cleantech and how those industries did or didn’t benefit from timing.

    Investors use timing in their own investment decisions. Roelof Botha, an investor at Sequoia, wrote about timing in his private YouTube investment memo from 2005, which was later made public.

    Botha’s memo outlined the progression of user generated content with shared text and images and that the next generation of content should turn out to be video based on the spread of personal video cameras and broadband internet.

    Botha wrote: “Digital video recording tech is for the first time cheap enough to mass produce and integrate into existing consumer products, such as digital photo cameras and cell phones, giving anyone the ability to create video content anytime, anywhere. As a result, user-generated video content will explode.”

    In his memo Botha also outlined the problem that existed in 2005: video content was difficult to share. Files were too large to email, too large to host, there was no standardization of file formats, and videos existed as isolated files without interaction between viewers or interrelation between videos.

    So YouTube’s solution made sense. Users uploaded videos and YouTube served the content to viewers. YouTube converted different video formats to Flash Video (Flash penetration was 97.6% of web users at the time). The videos were highly compressed and could stream instantly. Users didn’t need to download the whole video first. Creating a community meant that people could comment on the videos and therefore would watch more.

    And back in 2005 Broadband Internet into the home was also at critical mass. Traditional media also wanted to increase their online presence in order to follow their audience, which led to more interest in video. The timing was right for something like YouTube.

    Timing and You

    My informal survey of investors and what I’ve seen myself reveals that most startups don’t actually think deeply about the question of timing and most pitches don’t address the timing question.

    As I’ve asked investors what they actually see when startups pitch, I’ve heard that only around 20% of startups are direct on what their timing advantage is. In a formal pitch, most don’t have a “Why Now” slide. That means the remaining 80% of startups are leaving it up to investors to apply their own perspective.

    Founders and product leaders shouldn’t miss the opportunity to educate themselves on the ways timing could be an advantage. If you miss that opportunity, the danger is that others may misunderstand the situation and run in a different direction than you expect. Guiding others in that thinking helps show that you’re a good bet.

    By now I hope you’re convinced of the importance of timing and business. Not every situation calls for you to assess your timing advantages. But where you need to convince others that you’re on the right path, you can gain a lot by thinking through the way the world is changing and how you can benefit from it.

    I’ll go into more detail in the next post.

    “Timing Drivers Visualized (the Why Now question part 2)”

    Feel free to say hello here or at @porlando on Twitter. I hold “Why Now” workshops periodically. Contact me to learn about the next one.

    Here’s the list of other Why Now posts. If you like these, check out the Why Now book.

  • Corporate Accelerator Model

    This is a high-level, sanitized version of a plan I wrote for a company that wanted to start an accelerator. It’s partially from a corporate and hardware perspective. Parts have been redacted. I hope that it helps you in your own accelerator development. I’ve started and operated three startup accelerators so this is based on my perspective.

    1. Proposed Plan – Starting Point

    I wrote this based on my experience operating three very different startup accelerators on three continents and from assisting other programs. This is not a research paper. It’s my starting point for [company’s] situation based on what I have learned from our meeting.

    Given the above and our meetings, a high-level draft plan from idea stage to operations is presented below. I have taken the approach of filling in some of the document based on my experience and current knowledge of [company’s] goals. This is the start of the discussion, research, and program building.

    1.1      Establish Goals and Program Vision

    1.1.1      Discussions with involved stakeholders on program options. Formulate goals for program.

    1.1.2      Decide on program type relevant for [company]. While other accelerator models include the General, Hardware, Industry-specific, Toolkit-focused, Studio, Corporate, Challenge-based, University, and other types of programs, [company] is doing something different. Have clear program goals in order to construct the program.

    1.1.3      Determine how to attract companies and founders in related industries: semiconductors; big data and AI; next-gen displays, AR/VR; energy; digital manufacturing; life sciences, other materials engineering.

    1.1.4      Set program lifespan. Assign budget to keep program operational for a minimum number of years (accelerator strength comes partly from program continuity).

    1.1.5      Set company investments. What type of financial investment will be made in portfolio companies? Again, there are many options including notes/SAFEs, direct equity investment, equity without investment, future option to invest. What is the best fit for [company]?

    1.1.6      Set funding. How is the program funded? Is there a reserve for potential follow-on funding?

    1.1.7      Describe and start supporting research. Gather input from partners participating in the program. Perform market research on other comparable examples. Interview customer partners and industry groups.

    1.1.8      Determine KPIs. There are no industry-wide accepted KPIs for corporate or other accelerators. In each case corporate accelerators should generate their own KPIs based on what is important to them individually.

    KPIs should be developed through an internal process. Relevant KPIs might include financial metrics around market size, potential to help company exit, exit multiples, and more.

    1.2      Multiple Founder Models

    Founders attracted to a deep tech-focused program can be different than those in a general startup accelerator. Strong candidates in [company’s] program may not want to run their own company (they may be strong researchers but weak entrepreneurs) and they may not know that their capabilities are related to the semiconductor industry. Therefore, accept multiple founder types and work with them differently.

    1.2.1      Entrepreneurial founders. Treat these founders as you would other early-stage founders.

    1.2.2      Research founders. Few accelerators are successful with research-centric applicants. Related to that, many universities, for example, find it difficult to commercialize technology from their funded labs because excellent researchers are not always excellent entrepreneurs. [company’s] accelerator can benefit by welcoming in research founders differently.

    1.2.3      Adjacent founders. As above, pursue those not directly in industry (or who do not think of themselves in industry,

    [company] can bring in management teams (internal or external) to handle the business side for research founders. A model for adding management talent is seen in studio accelerators today.

    Alternatively, some founders may want to join [company] directly. This is an option to consider where the research itself is of greater value within [company] than outside.

    1.3      Avoid likely failure points

    Part of improving success is removing likely points of failure. I’ve noticed commonalities in what founders are bad at doing or should not be doing. These failure points are also relatively easy to avoid if identified up front. Remove these likely failure points by doing them for the founders or mandating that they have a solution.

    • Founder agreements (just enforcing that one item reduced my programs’ failure rates by 20%).
    • Employee agreements.
    • Proper corporate entity formation.
    • Grant writing support.
    • Recruiting support.
    • Professional website, logo, and other materials.
    • Help with finance and accounting, messaging, operations.
    • Professional online presence. Professional bios and photos, etc.

    1.4      Staff and Support

    Typical accelerator staff and support includes the below list. Managing the staff and support is often challenging. (Experienced people don’t always add value in an accelerator environment.)

    • Program director (runs programs, startup advisor, holds office hours, connects teams to investors and talent, builds program awareness).
    • Operations (manages mentor schedules, investor visits, workspace, housing/travel, events).
    • In-house developers and designers (to aid cohort companies as needed).
    • Legal services, patent services.
    • Providing access to senior decision-makers / corporate connections.
    • Managing training and access to equipment.
    • Recruiting and management development.
    • Marketing (builds program awareness, helps companies with their marketing).
    • Mentor list (can number from the tens to the hundreds, across various backgrounds). Many mentors engage on a voluntary basis. Few are paid or offered equity.
    • Support for visa applications, business bank account setup, incorporation, accommodation, post-program support.

    1.5      Access to Equipment

    Data to be collected and perspective set.

    1.6      Curriculum

    Data to be collected and perspective set.

    1.7      Mentors / Advisors

    I’ve polled many accelerators on the way they use mentors and advisors in their programs. There are two main schools of thought. Determine [company’s] style as part of discovery process.

    Opt-in: All mentor meetings are optional. These accelerators want their startup founders to do what they believe is best (including on whether to meet mentors or not) rather than follow orders.

    Mandatory: Mentor meetings are mandatory and frequent. In extreme cases, accelerators set up founders with 100 to 200 mandatory mentor meetings in the first month of program involvement. The purpose being to break down founder preconceptions, intentionally let them hear hundreds of opposing views, get connected to potential advisors, customers, and investors.

    1.8      Investors

    The investment community should see the accelerator as a source of strong deal flow. Investors should be happy to be invited to meet companies, attend demos, and more. Set expected behavior for the way invited investors treat portfolio founders. Develop relevant investor list.

    1.9      Demo Day

    A good demo day ends with most of the cohort on their way to receiving funding. This means that apart from packing the demo day event with the right attendees, the accelerator has introduced relevant investors to chosen startups, the accelerator sets guidelines for investors and founders, and the accelerator guides the startups through the entire process.

    Not every program benefits from a demo day. Determine if [company’s] program would benefit from a demo day or another format.

    1.10   Community Building

    Encourage networking via periodic events for current and former portfolio companies. I’ve found that something as simple as that online community increases success and keeps founders involved long term.

    1.11   Budget Allocation

    Data to be collected and perspective set.

    1.12   Plan Implementation

    For a more complex program, as this one is, a longer multipart rollout makes sense.

    1.12.1   Setup: Gain Awareness

    Generate upcoming program awareness through company network, news articles, industry publications, outreach to universities, individuals via online profiles and published research, ads, application platforms.

    1.12.2   Phase I: Pre-Accelerator launch

    To establish the new program and provide time to build it, first host a series of related events, possibly arranged around company themes of advanced display, advanced manufacturing, advanced materials, AI and big data, energy technologies, life sciences, semiconductor technology, etc. For example:

    • Conferences where targeted talent attends seminars and meets [company] representatives and others.
    • Produce a video series where company researchers talk about their work. Show the facility.
    • Build a contact list of relevant university departments, startups, and industry groups internationally. In the past, I kickstarted new programs via direct outreach.

    1.12.3   Phase II: First accelerator cohorts

    Team selection. Look for coachability, commitment, capabilities, impact on community.

    1.12.4   Phase III: Long-run accelerator

    Data to be collected and perspective set.

    The following is a response to questions from [company] and a plan for exploring and building a semiconductor industry accelerator program. I wrote this following our February 12, 2019 CTO office meeting and my group presentation.

    2. [Company’s] questions

    2.1      What are the key metrics used by other corporate accelerators?

    Key metrics vary wildly in accelerators of any type. When used, key metrics tend to be different based on timing:

    Early metrics: awareness, applicant volume, applicant quality, acceptance rate.

    Mid-stage metrics: investment size / percent of portfolio raising capital during or shortly after program, founder referrals, percent of cohort selling into the sponsoring corporation, percent of cohort acquired by the sponsoring corporation, grants issued, and above list.

    Later-stage metrics: portfolio valuation, company survival rates, investor feedback, company revenue, exits, ROI, and above list.

    It is important to remember that program metrics will not be purely quantitative. In the beginning (first couple years or portfolio under 25 companies) performance is often erratic.

    2.2      How can we be sure to monitor the progress and performance of the accelerator?

    It’s common to set goals for each company during their program involvement. “Standard” non R&D software-centric accelerators often set growth related goals, for example on weekly customer growth. This is an example of business metrics and does not fit with engineering metrics. We should develop a unique set of metrics.

    2.3      What are the legal implications to [company] around liabilities and IP?

    In past programs I’ve operated we have issued a program agreement to the companies we invest in, noting what investment, terms, and services are provided, as well as the accelerator’s limitation of liability, indemnification, right to terminate the relationship, etc.

    Legal implications depend on the structure of the program. Other general options include:

    • Joint Development Agreements.
    • [Company] forms a separate entity to invest in the startups and hold equity. Startup founders continue to own their IP. [Company] does not operate the portfolio companies.
    • If startups are responding to a challenge, they may be rewarded financially for their IP (challenge prize, acquisition, licensing, etc).
    • Legal agreement and training requirements before founders and team employees can access equipment, software, and other resources.
    • [Company] may desire for certain research to be submitted to academic journals, or to protect IP through patenting. Portfolio companies typically continue to own their own IP.

    2.4      What sort of peripheral support do corporate accelerators require (legal, HR, finance, etc)?

    The following roles will be helpful in any program. Also see section 1.4.

    • Legal. IP review, patent protection, patent expansion.
    • HR. Both for managing personnel issues, talent acquisition for incubated teams.
    • Finance. This is typically a weak point for many early-stage tech teams.
    • Marketing. New programs require months of lead time to generate awareness and source potential applicants. This can be achieved through targeted press, direct outreach to known startups, universities, relevant PhD programs, and via ads.
    • Application review. Review applications, interview team members, form balanced cohorts.
    • Business development.
    • Next round funding preparation.
    • Program management.

    2.5      How much does it cost to run an accelerator?

    To answer this question we first need to determine goals and the type of program. The following are the major costs to run an accelerator.

    • Startup funding, if included. Current benchmark for software and hardware accelerators is approximately $100,000 per company. [Company] may consider a different model, for example, with higher funding over long term involvement, or where funding remains below benchmark but where much of the value-add is in equipment and expert availability.
    • Equipment and production costs such as tape out, shuttle service, EDA tools.
    • Staff costs. Salary and equity for some participants.
    • [Company] team costs.
    • Cost of outside consultants. Wide range. I’ve seen outside companies charge in the millions to run a corporate program.
    • Promotional costs.
    • Workspace, events, travel, and housing. Some programs claw back some of their investment in the form of workspace rent. Events include cohort and mentor dinners, demo days, and investor roadshows. Some programs pay for team travel to and from the program. Same for housing. Variation depending on whether accelerator teams relocate or work remotely.

    2.6      What is the best structure to take if the goal for the accelerator is to be a strong magnet for the most innovative and promising startups?

    You won’t get there in one step. New programs have similar problems:

    • Awareness. New programs must deal with the lack of awareness, proving their benefit to portfolio companies.
    • There are many startup accelerators today, so what distinguishes this program from the others? Why should a startup choose this program over another? Why choose this program over working independently?
    • Programs tend to get better over time. Programs become known, generate referrals from portfolio founders and others, demonstrate their worth as companies raise money and are acquired
    • Building a successful accelerator does not happen in one step. I recommend a multi-stage rollout in this case, see section 1.12.

    2.7      How long will it take to develop a plan?

    The start of the plan is above in Section 1. I estimate that a fully researched plan could be developed in a couple months. Following the plan, [company] could commence kickoff activities and the multi-part program rollout. The actual timeline can be accommodated based on [company’s] needs.

    In the past for smaller software-only programs, I have gone from program approval to opening the doors of the first cohort in as little as three months. That short timeline likely does not work in [company’s] situation.

    3. Why Corporate Accelerators Fail

    The list of top reasons for corporate accelerator failure, in rough order of commonality:

    • The program was not provided enough time to succeed because of misaligned time scales (corporate needs to show results faster than the startups).
    • Misaligned risks and rewards. Are multiple failures tolerated? Do incentives for success fit corporate needs?
    • Inadequate program and staff resources and capabilities.
    • Located where it is difficult to attract talent.
    • Lack of internal support for program and startup investments.
    • Lack of internal champions to help startups integrate and sell into corporate sponsor.
    • The program ends up attracting startups that could not find other options (if corporate accelerator viewed as investor of last resort).
    • Using expensive name-brand operators without keeping knowledge in-house.
    • Investments viewed as competitors to internal projects.
    • Less connected to sources of follow-on funding options for portfolio companies.
    • Lack of long-term portfolio company support (program support ends at demo day or cohort graduation).
    • Did not build a community between portfolio companies.
    • Operating in a winner-take-all market where top talent goes to more established programs.
    • Short-term budgeting / misaligned business model (program budget runs out, unable to maintain the program long enough to generate returns).
    • Skewed metrics.
  • Corporate Innovation Approach

    None of the successful company CEOs I’ve worked with seek out innovation for innovation’s sake. They are after something else instead.

    In an uncertain environment, with pressure to grow their business, how should they evaluate opportunities?

    The last 20 years have left us with new tools and frameworks to evaluate opportunities for business growth. You probably know many of them…

    Understanding the customer, future customer, potential customer. Studying Disruption Theory and Blue Ocean Strategy. Determining whether you are (or will operate) in an existing market, resegmented market, or new market. Understanding your business model type, such as direct, indirect, or marketplace. The way you look at trends. Even learning from copycats…

    Then there are common ways to bring innovation in house in order to grow. Companies organize hackathons around their industry or tech. Longer-term efforts include the launch of an internal accelerator or incubator program. There are many flavors of these programs. I should know — I’ve operated three different accelerator programs, with three different focus areas, on three different continents. An internal program done well can support early-stage teams, provide access to high-level contacts, access to customers, and expertise. It can also be a distraction and produce minimal results.

    What these in-house programs also can offer is a portfolio approach to new projects. But running in-house accelerator, incubator, or innovation programs can be difficult to do at scale. What other approach could we use?

    I think in terms of maximizing “shots at goal.”

    Dilemmas and distractions

    Years ago when I worked in a new group at AT&T that was operating a new service to displace legacy business lines, we needed to operate separately from other divisions. We were culturally and financially at odds with the rest of the legacy business run by other parts of the company. Our main competitors were actually other departments of AT&T. I used to think this internal competition was an anomaly, but after time at other large organizations, from financial services to a university, I see how common it is. My own winning strategy for dealing with this: ignore the competition and focus on customers.

    Most do not take that approach. One company I know has run over 30 innovation projects without gaining a single customer. Each project was the brainchild of someone in-house. Each project had a budget. And none of them spoke to customers before spending on R&D and production. Result: years wasted, millions wasted, and jobs lost.

    As a friend mentioned, his Fortune 100 company has his team wear jeans and play foozball once a week in order to encourage creativity… I may be too quick to dismiss this behavior. Sometimes good things come just from getting people together in a low-stress environment. But the good things that come may be haphazard and not replicable.

    What has irreversibly changed

    In the last 20 years since the dotcom bubble, the cost to build a startup or new business has fallen by 100x – 1,000x due to fewer upfront costs, commodification of common processes, and better ways to test concepts. Speed to build has increased by 10x – 100x due to commodification of common tech components and processes and new programming languages. While it’s always going to be difficult to build a big business, getting the small ones started is easier. These changes are here to stay. But in spite of the above changes, if startups themselves don’t work out most of the time, why should we expect corporates to be significantly better?

    If we take a process-driven approach, there are new ways that larger companies can test new business concepts and opportunities at scale.

    Improve your odds of being right. Reduce your cost of being wrong.

    As with the decreased cost and time to build mentioned above, the cost and time to gather useful insights from potential customers has also fallen. Over the past 15 years we’ve come to understand and apply customer discovery interviews as a way to learn. What’s changed beyond customer input in more recent years is the ability to test in rapid iteration, for example by going off-brand and testing multiple product concepts through targeted online ads. The speed of data collection and ability to make modifications is orders of magnitude beyond what earlier versions of this method could achieve years ago. This is rapid experimentation. Start with customer insight, generate five concepts, expand those into 50, test those with ads or low-fidelity MVPs, look for early metrics of success, double down on the more promising ones, and only then short-list the most promising handful for prototyping. Depending on complexity, this rapid experimentation process could take as little as three to six months and be significantly less expensive than betting all on a pre-selected small number of concepts from the start. More shots at goal. Lower cost.

    You never eliminate risk, but what is risk after all? Risk is the cost of being wrong. If you are able to lower your downside by decreasing your upfront investment and also increase the odds that you make the right bets, then you have decreased your risk. If you take a portfolio approach to testing concepts and move quickly, you can also improve your odds of building something big.

    After my experiences working at Fortune 100 companies, and more recently working with hundreds of startups, I want to bring what I’ve learned to larger organizations. Let me know when you’d like to talk.

  • Calculating Critical Mass

    You’ve probably heard the term “critical mass” tossed around when discussing startups (especially ones like social media products). The term is usually either used in the form of “we reached critical mass and then things just took off” or “we don’t have critical mass and we can’t grow…” But what is critical mass? How do you calculate it? And what is therefore the number of users that these products need in order to have it? Critical mass is different from “product/market fit,” another loosely defined term, in that there is a number we seek, even if no one admits to knowing what it is. With product/market fit there is no minimum number — your business just ends up growing faster than you can handle.

    It’s also good to think of what critical mass does not mean. It doesn’t mean that your business is cashflow positive, that you have good margins, or that you have lots of users. It’s something else — the point at which you have enough users or usage to keep sustain the product.

    How did we get here?

    The term critical mass does not originally come from social products or startups. It comes from physicists studying nuclear fission. Basic introductory definition: “A critical mass is the smallest amount of fissile material needed for a sustained nuclear chain reaction.” Read at least the Wikipedia article and try out the equations.

    Many things impact critical mass in nuclear fission. From Wikipedia again, the following can change the point of criticality: Varying the amount of fuel, Changing the shape, Changing the temperature, Varying the density of the mass, Use of a neutron reflector, and Use of a tamper.

    In other words, in fission, the critical mass is not static. It changes depending on those other factors. Here’s the nuclear fission critical mass formula.

    Where M is the total mass, m is the nuclear mass, s is 1 + the number of scattering events per fission event, ẟ is the total interaction cross section, ⍴ is density, and f actually is a fudge factor (their words, not mine) that accounts for geometrical and other effects. If the value is 1 or greater, the fissile material with go into a critical mass chain reaction.

    Once I saw that fudge factor, I stopped feeling so bad about only trying to come within an order of magnitude when it came to critical mass for a social product.

    The above ways to change the point of criticality of fissile material are each pretty instructive too.

    • Varying the amount of fuel. The most direct way to think about a minimum amount of stuff needed to attain the critical mass chain reaction.
    • Changing the shape. That is, a thin layer of fissile material will not reach critical mass, where the same amount rolled into a ball may achieve it.
    • Changing the temperature. This is mostly related to expansion.
    • Varying the density of the mass. Less dense: more needed to become critical, if it can become critical at all.
    • Use of a neutron reflector. Sending escaped neutrons back at the fissile material to get another chance at causing a chain reaction.
    • Use of a tamper, another way to send escaping neutrons back at the core.

    You might even start to see some similarities in how we could look at critical mass in a social product.

    But of course, the above equation isn’t completely relevant for social products. Humans are different from atoms. It’s tough to make a critical mass calculator without thinking through those differences. But it is a starting place. But when a term doesn’t have a clear definition people start to apply it loosely, so I’m going to rewrite the critical mass formula, with human users in mind rather than molecules.

    First, how do we define critical mass for a social product without relying on “you know it when you have it, because then everything goes well” type of circular reasoning? My critical mass definition is the minimum number of users you need to sustain user value in the product with no other product changes. This is product critical mass, not business critical mass. Critical mass in business (when your customers make the business sustainable) will almost always be much higher.

    Even if we disagree on how to calculate critical mass, we can say that we don’t have it if a product becomes less valuable in aggregate for its users over time when there is no other change to the product itself. (There are many products that barely changed over years but where value remained, Twitter being a modern example.) So, not having critical mass should result in less action per user over time, even if the total number of active users stays the same. Having critical mass should mean that we maintain our users and most likely grow them — churn will be low and more people are likely to want to join.

    What is the point at which user behavior means that the product sustains itself? That is, factoring in how much people use the product as it makes sense to your business (like messages sent, interactions, referrals), plus users lost through churn.

    Estimating critical mass for a social product

    The purpose is to answer these questions:

    1. Do we have critical mass at the current number of users? If not and if all else about the product and usage remains the same, what number of users needs to be added?
    2. Do we have critical mass at the current amount of usage? If not, what do we need to change about usage in order to have critical mass at the current number of users?

    For now, my inputs are these:

    • Percent of users active in time period. We can imagine two different products, one with a high percentage of active users (could be because of recency or other factors that keep people engaged) the other with a low percentage of active users (low need to log in). A higher percentage of active users can sustain a smaller overall population of users. So critical mass would be lower if active user percentage is higher.
    • Necessity and expectation of frequency. Some social products (like a microblogging service) only make sense when there are frequent new contributions from many users. Messaging apps or SMS, can have critical mass with smaller engaged populations (the extreme being just two people to send messages back and forth). Other services have much lower, or different, requirements (like a time-based app where users aggregate at specified times of day). Overall, a larger critical mass will be needed when a population is spread around every time zone. A smaller critical mass will be needed when a population is concentrated around a smaller number of time zones. That is, if there is a natural busy hour for activity shared by the user population, fewer people will be needed to attain critical mass.
    • Activity per user. Do users browse the content of others or do they also contribute?
    • User activity needed to cause a reaction from another user. What does it take and how do you measure and encourage it?
    • Percent of users who take an action in time period. Features such as the “like” makes it easy to take an action with a single tap.
    • Impact of messages received on messages sent percentage. This is similar to the probability that a fission event creates other fission events.
    • Other users’ impact on retention or churn. Likelihood to remain active if user receives action from another in time period
    • Amount of value from single-player mode or other way to get value without user interaction. This enables the product to attain critical mass with a smaller number of users.
    • Unaccountables. Time, place, UI / UX, subpopulation peculiarities, and other issues that act unpredictably. If the physicists used a fudge factor, I will too. This is also why I’m happy estimating this within a factor of 10x for now.

    I’m not going to write a formula now, because I’m still thinking through the variables and am figuring out how to weight them. What I’d really like is some actual data to test against. Want to contribute? Please get in touch here.

    But in general, I’m expecting something like these variations:

    • Messaging app like texting: two people minimum in the extreme example. This is the one that will cause the most disbelief. Remember, we’re not looking for what sustains the business financially. Depending on your revenue model, those numbers can be dramatically different anyway. Instead, we’re talking about what sustains the product. In this extreme case, just two people could sustain usage and get value from the product and then go on to invite others in.
    • Messaging app like Slack: 10x the above for one group. That’s enough for value from the small crowd, info from the group leader, plus enough people you want to talk directly to for one-to-one messages.
    • Broadcast / microblogging service like Twitter: 1,000x the above. That’s enough for value from the crowd plus enough people you want to message directly.

    The above are the best case scenarios (lowest critical mass numbers), given the variables. In most cases, where the product still needs work, the numbers will be much higher.

    But I’m making the assumption that there is some predictability here that leads to better understanding users and systems. I might be wrong and there typically is not enough that can be predicted. But if we can improve our guesses, then talking about critical mass will shift away from being a loose concept and could carry more value as something at quantifiable, at least within bounds. I’d love to look at actual data of social products at their critical mass tipping points. If you have anonymized data you’d like to share, please contact me so we can refine the theory alongside actual results.

    How can you reach critical mass for your product?

    You can’t get there in one step, so here are a series of steps that help:

    • Increase retention. Critical mass requires high retention for different reasons than typical, such as the increased costs of acquiring new users. Focusing on critical mass, you want retention to be high because repeated usage by the same users is better than occasional usage by different groups of users.
    • Increase engagement. In the social media examples above, fewer users that are engaged can make up for more users that are not engaged. Because some products depend on the relationships between users, a small group of highly engaged users produces an effect that is preferable to a large number of unengaged users.
    • Understanding the business you’re in. In marketplace services, a balance between supply (for example sellers on ecommerce sites, or drivers on rideshare) and demand (buyers on ecommerce or passengers on rideshare) is so important that these services are often careful how they launch. A marketplace startup will have an easier time focusing on one product category or one geography rather than launching with everything, everywhere.
  • The Most Common Problems (University Student Version)

    I just finished teaching my tenth college course over three and a half school years. Across those 10 courses, I’ve had approximately 350 students in my classes.

    During and after every semester I try new formats and reflect on what I should change, based on what’s working and who happens to be in each class. After 10 courses, it’s time to more seriously reflect on common areas of trouble for students. I make the claim that if these problems could be removed, then everyone would learn more quickly and more overall.

    Don’t mistake this for a complaint. I’m presenting what I observed over these 10 groups of students. And don’t mistake this for a indictment of millennials. Overall, I’m impressed with this generation. Instead, let’s look at the point at which I see them – as students in a top university before they have started to work.

    Lack of math skills.

    This was the biggest surprise for me. Around half of the typical class population is not comfortable with math – and here I mean business math. Nothing sophisticated, no calculus or number theory. Just comfort with using addition, subtraction, multiplication, division, exponents, and percentages. Ability to do some of that in your head.

    Ability to memorize formulas and apply them in other situations. This subcategory of the above turned out to be a huge problem. When I was a new professor I spoke to a colleague who had just given a pop quiz on topics that the class had discussed for a month. Everyone in the class failed. My colleague must be a terrible teacher, I silently concluded. I decided to try the same thing and handed out a pop quiz based on topics the students had confidently discussed for a month. Class average: 48%. I was shocked, but showed the answer key, went through the questions again, and told them to expect another pop quiz sometime. One month later I gave the exact same quiz. Class average: 70%. That result led to one of the biggest changes I made in university teaching. I call it “tricking people into learning.”

    Estimated time for a student to improve to adequate level: 20 hours.

    Belief that they don’t need to memorize and internalize formulas and definitions.

    Without the memorization, you often fool yourself into believing that you understand and can apply the knowledge in different situations. This is one area that should have the biggest ROI on student time.

    Estimated time for a student to improve to adequate level: 2 hours.

    No knowledge of Excel.

    If there is one tool that you’ll use after graduation, it’s Excel. For the record, I love Excel. Sure, there are more powerful programs that do similar things, but for accessibility and universality, Excel still wins. One of the good random things that happened to me was for me to find an Excel manual during an early management consulting project that was going slowly. I spent a good part of each day reading it and trying out formulas. Finding that book easily saved me hundreds of hours over the years. Now, while I do teach within a business school, perhaps half of my students come from other areas of the university – engineering, communications, cinema, arts and sciences. The lack of Excel knowledge, and the pain with which they learn it, are just too extreme. Even the ones who have taken accounting classes, a student told me, do their accounting spreadsheets by hand. I do not believe that that hand work is intentionally there to guide them into better understanding of business accounting.

    Estimated time for a student to improve to adequate level: 10 hours.

    Ability to stay focused in class without devices.

    I have tried every combination of device usage in my classes including no usage, total usage, usage only when we read a case study and on and on. Hands down, zero usage wins. Note that I teach undergrads and this finding may not hold for grad students. I also teach an elective that is more quantitative and based on using online tools. In that class I deal with laptop usage for class. But in my other class, which is a required class for the entrepreneurship minor, I have banned devices and laptops once and for all. After doing so, students become better at thinking on their feet rather than simply looking up a response, they have better discussions with other classmates, and they don’t need to avoid online distractions because they’re not online.

    Estimated time for a student to improve to adequate level: n/a.

    Ability to communicate well.

    In general, the students are pretty good at standing in front of the class and presenting their projects. This is something I only had to do once in my time as an undergrad. For today’s students, in-class presentations are pretty common and their confidence shows. The area they could improve, or eliminate problems from, is in written communication.

    The first area is email. I receive a good number of emails which start with the word “Yo,” or “Hey,” or which are tough to read because, I have to hope, lack of effort rather than lack of ability.

    The other area is writing longer papers. Lack of proofreading, spelling mistakes, using voice-to-text (it shows) make otherwise smart students look pretty bad. The proofreading and spelling mistakes are easy to fix with software. Being able to write well though… Commit to reading lots of good books and articles and writing thoughtfully over years.

    Estimated time for a student to improve to adequate level: 1,000 hours.

    Other Tangents.

    The most common question students bring up when we go off on larger issue tangents. Is a university degree worth the high cost of tuition? I reflect that I could take one half of the number of students I currently teach, charge them half as much a credit as the university does, and provide a better learning experience while also earning more. This is a reality that the American university will be forced to deal with in the next generation. It’s going to be fascinating as the change happens. What will replace the university network though I don’t know.

    I am not a university academic. Becoming a professor was entirely accidental for me – I never applied for the role, but because of previous work experience was asked to teach. I’m glad I did. Teaching has changed the way I express ideas and think about their impact.

    New changes. Since there has been so much similarity in the way different classes of students struggle with my classes, next semester I will distribute a list of likely problem areas. Avoid these and you will improve your chances dramatically. History suggests only a 20% class body follow-through on the offer, but I’ll take it.

  • Monopolies I Have Known

    In light of Mark Zuckerberg’s Congressional testimony (and Facebook’s own natural monopoly) I reflected on some of the monopolies I’ve known. Given what Facebook does I focused on communications companies, which historically were somewhat close to what social networks of today provide.

    AT&T’s government granted monopoly

    We trace this back over 100 years to the Kingsbury Commitment of 1913. That agreement set out the rules for AT&T’s place as the US’s national carrier and how it needed to work with local service providers. In the early days of communications technology build-out, national governments often stepped in to guide (or control) what telecommunications companies were able to provide which services and for what benefits of the population.

    AT&T however was known as a “gold-plated” monopoly. Phone service in the US extended to rural areas that were more expensive to build out (not a condition seen in every other country) and the degree of innovation coming out of the company was dramatic. Some of their innovation portfolio includes dial tone, mobile telephony (car phones originally), the transistor, Unix… This gold-plated aspect led to some interesting experiments in employee training, including a foray into teaching the humanities (see The Organization Man Goes to College: AT&T’s Experiment in Humanistic Education). This investment in employees is comparable to Peter Thiel’s argument that companies like Google are also monopolies — and that’s why they take care of their employees.

    Telecommunications hardware used to be much more locked down than today. It used to be illegal, then uncommon, to own a landline phone in the US. AT&T rented them. The monopoly granted AT&T allowed the company to regulate any devices that connected to their network — a term that was interpreted loosely. Legal action by AT&T to enforce its monopoly dominance included preventing a company called the Hush-a-Phone (basically a cup that fit on top of your telephone handset in order to shield the speaker’s voice) from selling its products. Why go to such lengths to prevent this physical product from existing? If you have near total control, any little step away from that is problematic.

    Interestingly, Peter Drucker argued against AT&T’s monopoly breakup in 1984, but on behalf of national security. The national security and telecommunications infrastructure and equipment issue is still a concern today (actually part of an ongoing concern for at least the last 20 years) with Chinese equipment provider Huawei.

    The swing of general communications technology moved from government enforced monopoly to decentralized.

    China Telecom

    China Telecom has a much shorter history than AT&T and being based in a different country with different needs and at a different time, competition to this monopoly came in different forms. An early competitor was China Unicom, which in the mid-1990s had low single-digit market share overall and market penetration in just a few urban areas. The company was dependent on China Telecom for national interconnections (which sometimes was cut). Starting in 1998, China (as did other parts of the world) started to allow more companies to offer telecommunications services, initially through (lower quality) Voice Over IP  (VOIP) calls. These early calls were not like the Skype you later came to know. Rather, the caller would dial the number of a local gateway and then their destination phone number (basically operating like a calling card except that the voice traffic was routed at least partly on an IP line). Later enterprise implementations were seamless and did not require the caller to dial multiple phone numbers. I remember various Chinese government agencies during this time exploring VOIP network rollout, some with official licenses, some because the founder’s relative was so-and-so and they were operating in the grey market (many long stories there).

    Impact to the consumer — the official and later market determined price of a phone call dropped significantly. Back in 1997, the official rate to call from China to the US (something very few people ever did) was US$1.30/minute. During that time I knew someone who was arrested for offering cheaper non-official services. By 2000, the rate had fallen to around $0.10/minute. It’s been basically free for years now.

    In China, total subscribers (both fixed and mobile) was 7 million in 1990. The number of just mobile subscribers in China is now 1.6 billion. Yes, that’s more than the total number of people in China. More and more countries have mobile phone penetration of greater than one per capita. Oh, and Unicom later went on to build an enormous VOIP and mobile network.

    Other countries have dealt with communications technology in different ways. In Myanmar (then Burma) people went to jail in the 1990s for illegal possession of a fax machine or a modem (the Internet was only made legal there in 2003). These actions (as elsewhere around the world) were more based on protection government communications control than consumer access.

    The above were state granted and regulated monopolies. However, we could also think about how else the initial national communications infrastructure might have been built out around the world.

    Now back to Facebook. One of the interesting exchanges from the Senate hearings was this one between Zuckerberg and Senator Graham:

    Graham: Who is your biggest competitor?

    Zuckerberg: Senator, we have a lot of competitors.

    Graham: Who’s your biggest?

    Zuckerberg: I think the categories — did you want just one? I’m not sure I can give one. But can I give a bunch?

    Graham: Mmhmm.

    Zuckerberg: There are three categories that I would focus on. One are the other tech platforms, so Google, Apple, Amazon, Microsoft; we overlap with them in different ways.

    Graham: Do they provide the same service you provide?

    Zuckerberg: In different ways, different parts of it, yes.

    Graham: Let me put it this way: If I buy a Ford and it doesn’t work well and I don’t like it, I can buy a Chevy. If I’m upset with Facebook, what’s the equivalent product that I can go sign up for?

    Zuckerberg: Well, the second category that I was going to talk about —

    Graham: I’m not talking about categories. What I’m talking is the real competition you face.

    Other articles don’t focus on this point, looking at social networking businesses across different markets and usages. If you think of just the casual, social pieces of peoples’ lives, what is the biggest social networking competitor to Facebook?

    Sources of Monopoly Power

    The list of sources of monopoly power in which Facebook is strong includes: no substitute goods, network externalities, and increasingly technological superiority and manipulation.

    Facebook has an advertising revenue model. Therefore, anything that interferes with the company from earning ad revenue from their user generated content is likely to be seen as a threat. In 2008, Power Ventures, a social network of social networks was sued by Facebook on multiple counts (another interesting take is here). Part of the case is still pending. What did Power Ventures do to draw Facebook’s attention? They enabled users of Facebook and many other social networks to see all of their feeds in one place — and without the original social network generating, or being credited for, the advertising. Good for the users (convenience) but bad for the ad-based companies.

    In its 2017 annual report, Facebook shows 184 M daily active users in US and Canada — the smallest number by any of their regions, which are all more populous. By revenue, however, it’s the reverse. The US and Canada, having more developed and profitable advertising markets and what seems to be more frequent usage, generate the highest per user revenue (over $84/user in the US and Canada for the 2017 annual report’s most recent four quarters, p 38). Facebook’s social networking ad revenue market share approaches 80% in the US.

    I won’t go into the details on the Cambridge Analytica scandal, with which anyone reading this far probably already has background. If it weren’t for Cambridge Analytica, when would Zuckerberg have testified to Congress? It would have come eventually.

  • Decision Speed and Feedback Loops

    Depending on your work and life, you will have different situations in which to make decisions and to learn from them. Some of this is related to the speed at which you make decisions (lots of small ones versus few large ones) and the quality and also speed of the feedback you receive.

    In my roles with three startup accelerators and incubators I’ve been fortunate in that over the past five or six years I’ve been able to make five times as many decisions as I would in a VC role, as well as receive more rapid feedback than normal. Here’s a breakdown of what created opportunities for those decisions and that feedback.

    Create Opportunities to Make Many Trackable Small Decisions

    Hong Kong / AcceleratorHK. Chose 12 startups across two cohorts for the first funded startup accelerator in Hong Kong. Acceptance rate approximately 6%, which means 200 companies were evaluated to find the 12. $20K – $50K invested per startup.

    Rome/Vatican / Laudato Si’ Challenge. Chose nine startups in one cohort for an environmental-tech focused startup accelerator affiliated with the Vatican. Acceptance rate a little under 3%, which means over 300 companies were evaluated to find the nine. $100K – $200K invested per startup.

    University of Southern California in Los Angeles / USC Incubator / Marshall Greif Incubator. Across three years, 82 startups have participated across ten cohorts. I started the program three years ago and after the first year, the acceptance rate has hovered around 10%, which means approximately 700 companies were evaluated to find the 82. This program is different from the two above in that it is restricted to founders with a connection to USC, there is no financial investment in the companies, and that I sometimes get to know the founders before they apply and see the progress they make. I have declined to offer spots to founders who were too early only to accept them when they reapplied later on. This program is run non-stop with three intakes per year (unusual even for fast-paced accelerators).

    If I were at a “typical” VC firm, I’d be involved in decisions to accept (invest in) perhaps five companies per year. True, I’d look at more companies per year (perhaps 1,000 to get to that five) and the due diligence would be much more intense. Further, judging whether the decision was correct would be more difficult as well. If the VCs need to eventually exit their investment positions, in my case at the Incubator at least, I really just need to see signs of progress (anything from the company receives their first investment, increases their rate of growth, grows revenue, builds a team to things that were prevented, such as the reduction of co-founder problems). I average 30 companies accepted per year, at least over the past three years with 300 to 600 evaluated per year. The feedback loop cycle time for metrics I care about is also much shorter, at around one year rather than perhaps several years at a VC.

    As a result, I’ve improved my accuracy in founder and company evaluation.

    Feedback Loops in Other Places

    I never thought I’d teach at a university, but it has changed the way I think about learning and getting feedback. In my first year teaching I had a casual conversation with a colleague who admitted that all of the students failed a recent pop quiz that was based on what the class had discussed for the past month. I remember thinking “wow, you must be terrible…” I decided to try the same thing in a short quiz that included a couple formulas, a definition, and some basic business math. Result from that pop quiz in a class of 47 people: an average grade of 48%.

    I couldn’t get this out of my head.

    I provided the answer key and reviewed the questions with them. I told the class to expect another quiz like that one. One month later I gave the exact same quiz. Result: average grade of 70%.

    Again, I couldn’t figure this out. Why such low grades? I wanted to get to 100%.

    I provided the answer key and reviewed the questions with them. I told the class to expect another quiz like that one. In the last week of class I started by reviewing the same information. I gave the opportunity to ask questions. I cold called students to provide answers. I put the calculations on the board. I reviewed it all one more time.

    And I gave the exact same quiz.

    Result: average 95%. That meant that I still didn’t reach a couple people in the class.

    If you’re not used to receiving feedback that you don’t know something, that you must improve in some way, and it’s inescapable (the repeat quiz rather than a one-off unlucky quiz) it can be terribly upsetting. It was to a few students.

    Mostly we do not seek out opportunities to test our proficiency in subject matter and in different situations. When we do, it’s often a one-off test. We don’t revisit our proficiency again and again, forget, and fall into bad habits. Some professions, like medicine, require regular learning throughout a career, not only to review and test our retention of what we learned, but also to learn new techniques. We rarely do this in other fields. In some areas of our lives we may even actively fight the opportunity to learn how good we are.

    If you end up thinking about this and implementing ways of making more decisions and developing feedback loops, let me know what techniques you use.

Get new posts by email A few times per year. Deep dives into tech, unit economics, timing, and more.