(For a full walkthrough of unit economics, read the book Growth Units.)
Those days of easy money, unprofitable growth, fast closes, and record-breaking valuations are over. For a while.
If you’re running a startup that is still making its way toward financial sustainability and Product Market Fit, what do you do now to improve your odds of being able to raise your next round? Or to improve your ability to extend your runway? And to prove that your startup will survive long-term?
You probably need to improve your unit economics — the performance of your business’ customer acquisition cost and customer lifetime value and the balance between them. If you don’t really know what that means, haven’t spent much time working on improving your unit economics, or aren’t sure how to start, you’re not alone. Most startups I talk to are in the same situation.
I actually find that the definition of unit economics varies from person to person. After working with lots of startups on this, I think of the unit as the customer, not the individual sale of one item. The customer is the reason the business exists. Understanding what contribution margin each purchase (of which they may be many) that the customer makes, plus the cost to acquire that customer, is the key. If you only think of a unit as each individual purchase, it skews your thinking to the short-term.
This is some of what I’ve learned from working with lots of startups and teaching the unit economics topic at university. (This post assumes some knowledge of unit economics.)
Awareness Levels
When it comes to unit economics I find different levels of awareness from founders and executive teams.
- (Level 0: Doesn’t know what the question means.)
- Level 1: Can give a basic answer, like “Our CAC is $50,” or “LTV is $1,000.” But they figure this out by just taking last month’s marketing spend and dividing it by the number of new customers. Or they take an assumed churn rate and divide that into their per customer contribution margin (or worse, revenue). When I hear single numbers, I know that they haven’t gone into detail yet.
- Level 2: Can answer the question on a per channel basis for CAC and a per segment basis for LTV. Can tell you how much they’re putting into each channel and what retention is like per segment.
- Level 3: The above and they’ve experimented with their pricing, are tracking cohort metrics and trying to improve them, they know the different expected retention behavior per segment. Knows industry benchmarks.
- Level 4: They have expectations for how things will change as they put more into specific channels (CAC goes up/down by how much? When will a channel likely stop performing?) They’re experimenting with how to change the product to drive LTV or shorten payback periods. Knows that they shouldn’t simply aim for industry benchmarks.
- Level 5: Looking for ways to defend or build a moat in order to protect what they’ve gained above. Understands the overall system.
Figuring out the above is a process and takes time. Companies I’ve helped certainly need months (and the process of improvement actually never ends). Once you make some progress, you’ll be in a much better place to pass through due diligence and raise your next round or become financially sustainable sooner. But here is a general process I follow.
The General Process
In the beginning, I like to get to know the startups first, what they are building, what their goals are, their value proposition, customer targets, and more.
But the general process I follow is this:
- Stop the bleeding. Cut unproductive marketing.
- List the CAC channels and the CAC for each. Or figure this out if it’s not known.
- List the customer segments and the LTV for each. Or figure this out if it’s not known. This takes more time than figuring out CAC since some time must pass to understand likely customer behavior.
- Understand how the above two points fit together.
- Discover current benchmarks that the company may be measured against, whether by industry, company type, or current investment/economic environment. This is sometimes a moving target.
- Talk the team off the ledge when things look tougher than they thought.
- Develop leading indicators to help project future results.
Benchmarks
In times of low, low interest rates -> growth is the priority.
But in times of higher interest rates (at least by recent historical standards) -> profitable growth is key.
That means that now (2023), in a time of higher interest rates and more cautious investing, showing strong fundamentals is a better strategy.
Related to the above, you should be aware of various benchmarks that exist for companies in your industry and stage. Where do these benchmarks come from? Not some totally objective source. Rather, they typically come from what investors, advisors, and others in the startup world see and their general expectations for what “good” performance looks like. These benchmarks change over time.
Here are some to know.
Payback Period
This is an important metric for me. Payback period is the time it takes for contribution margin generated by customer payments to pay back your CAC.
For example:
If CAC is $100 and LTV is $500, how long does it take you to collect that $500? Are you projecting $10/month for 50 months? If so, your Payback Period is 10 months ($100 = $10 x 10 months).
Many startups have much longer Payback Periods. Longer payback periods can come from being inefficient at customer acquisition and paying too high of a CAC, not charging high enough prices, not charging at all for some users with freemium models, low retention, and more.
If you can shorten your Payback Period, it’s a magical thing. Imagine the extreme case of being paid back right at the beginning. You can put that money into the next customer acquisition.
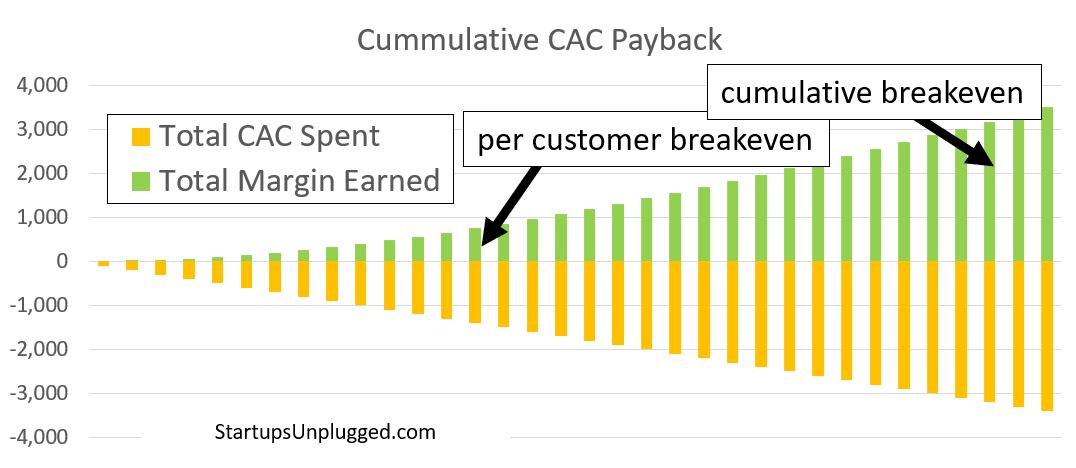
That’s payback period on a per acquisition basis. What about in the aggregate? As in, if we keep spending on customer acquisition up front, but only see the returns over time, how long do the losses accumulate before we start to be net positive?
This is where startups can grow themselves broke. Here’s a simple, but rosy scenario of a company that continues to invest in new customers at the same rate: CAC is $100, the company earns back $10 in contribution margin each month, and retention is 95%. These numbers are likely to change all the time (or at least CAC and retention), but this will give you an idea. If this rosy scenario without even considering discount rates is tough, what will your situation be?

In the chart, per customer CAC payback takes 14 months (which for many funded startups would be very fast). But the key is that since the company must keep spending each month, the losses accumulate until enough customers have paid off their CAC. Keeping the same pace throughout the process, it’s not until month 32 that all spending on customer acquisition breaks even. That means that the business must be able to lose money until month 32 in order to maintain this pace of acquisition. (We’re also ignoring other costs not counted in unit economics here, so the situation is even bleaker.)
What can you do if you can’t wait that long? Improve retention, lower CAC, increase contribution margin, and spend less.
Rule of 40
Another benchmark that’s used today is the “Rule of 40,” mostly used with software and especially SaaS businesses that have some level of business maturity or predictability, often at least at $1M MRR (monthly recurring revenue). I’d say that it’s certainly talked about at businesses with less revenue than that. This rule is measured as:
Revenue growth as a percentage + Profit margin (various types are used)
And with the target being 40% or higher.
This is a good heuristic, but of course you have to dig deeper.
First, there are a number of ways to get to 40%. Each tells a different story.

Rule of 40 measures the Revenue growth rate + EBITDA (or sometimes Operating Profit) margin. Below I just call it profit margin. The benchmark is for the total to be 40% or greater. Blue is Revenue growth. Green is EBITDA margin.
1 and 2 (Revenue growth is dominant). In these two, revenue growth rate is greater than EBITDA margin. That represents companies that are growing revenue quickly, but for which that growth may not be profitable.
3 and 4 (profit margin is dominant). In these two, profit margin is greater than the Revenue growth rate. That represents companies that are becoming more profitable, but for which that profitability may be holding back their top-line growth.
5. A balance between the two.
6 and 7 (Decline in one of the two inputs). In these two types, one of the two metrics, Revenue growth or profit margin are declining, but the other one makes up for that decline, for the purposes of the Rule of 40 metric. That can represent a problem or changes within the organization. For example, #6 could represent a company that has figured out how to grow revenues but by adding team members or spending a lot more on customer acquisition. That could be OK in the short run as long as the business can become more efficient later. #7 could represent a company that has chosen to eliminate unprofitable customers. Can it make up for that revenue loss by focusing on another customer segment?
Early on, you might need to have a negative profit margin. It’s even expected for early-stage companies that are in theory scalable.
Early on, you might also need to experiment with the product, pricing, targeting, and more. In the process, revenue can suffer. But that’s part of the process of figuring out your business model.
And early on, you might expect that your revenue growth should be the main driver of this metric (numbers 1, 2, and 6 above).
And another way the Rule of 40 can be misleading is with the percentages themselves. Imagine a small startup with only $10,000 in Revenue (it happens). If they double that to $20,000, they’ve just grown the left half of the calculation by 100% without meaningfully impacting the business. That’s why this rule has to be used carefully (or not at all) with early stage companies.
Using this rule with later-stage businesses (or even public companies) means that you would use annual numbers for the revenue growth percentage. But for an early-stage business, revenue growth could be at 10x or more per year. If you were to use the Rule of 40 with an earlier-stage startup, using monthly or quarterly growth would be more appropriate.
Know that investors may look to the Rule of 40, but also know that it’s not the single metric to optimize for when raising capital. A survey of 200 software companies showed that only around one-third maintained this, with only 16% exceeding the metric. Where did this rule come from? Apparently, just one board meeting.
CAC to LTV Ratio
This is another benchmark that you hear a lot. And the standard ratio you hear for CAC to LTV is 1 to 3 or 1 to 4. That is, for every $1 you spend acquiring a customer, you should earn $3 or $4 back.
This is helpful, but can be misleading for a few reasons.
- First, where does that multiple come from? Why not just aim for anything better than 1 to 1? The buffer is there because LTV doesn’t represent all the costs a business incurs in order to gain and serve customers. There are other expenses, like rent, non-marketing or customer-facing employees, healthcare, insurance, etc that don’t get counted in gross margin. The buffer gives the business some room to still be unit profitable.
- The second reason is payback period, as described above. If you have a lot of money flowing out the door on customer acquisition and time before you get paid back, you probably want multiples of it on the return trip.
- Early-stage startups often don’t hit this ratio. They sometime have to pay higher CAC and they often have low or even negative LTV as they improve the product. As long as they’re improving, this doesn’t have to be a problem.
- But the third reason is that it’s just too simple. It’s a standard benchmark that came to be used. You should reevaluate it depending on your goals. For example, if you’re after market share, then you could run a ratio closer to 1 to 1. If you’re not interested to grow at this time, but want more profitable growth, go higher than 1 to 4.
Before investors ask about your CAC to LTV ratio, think about a few things:
- Where you are today is not the long-term. Your CAC may be expensive in the beginning as you figure out who your idea customers are, how to target effectively, and build referrals. I often see per channel CAC start high, then decline to a point at which its profitable, and then increase again as you run out of targets in the channel. As you move through that curve you need to add new, more profitable channels of acquisition and also figure out how to generate customer referrals.
- Estimate where you could bring these metrics long-term. How would LTV change as you improve the product, increase retention, extend the product line, and reduce per unit costs? Pitch that future state rather than the current state.
That cumulative CAC payback chart from above? Those customers are well below the 1 : 3 ratio.
PMF Engine
The term “product-market fit” gets thrown around a lot. People use different, vague definitions for it. I’ll summarize it as having a product that can grow profitably (doesn’t sound as impressive as “PMF” though). That means people want what what you have.
Having PMF (or being close) is something that helps along the way to good unit economics.
But how do you know you’re on the right track? What leading indicators could you use to help?
For this, I have to give full credit to Rahul Vohra, the founder of email service Superhuman.
If you’re building the right thing for the right audience his “Product Market Fit” Engine is a way to figure this out. You can watch a video of him speaking about it, but the basic steps are:
- Survey and interview existing customers to understand what they value and to learn about new market segments.
- Segment the customers into ideal and non-ideal customer personas. Measure how well you’re satisfying their needs.
- Analyze what the ideal personas value in your surveys and interviews.
- Improve the product for the ideal personas based on what you heard from them.
- Experiment with secondary persona preferences to expand the product line.
You can track how well you perform on these activities as a way to measuring PMF. Is this exactly unit economics? No, but the process will help you know how well you’re serving the right customers. That in turn connects to your ability to retain them, charge more, and expand your offerings.
Negative Churn
Another metric people love to talk about is negative churn.
Negative churn sounds impossible. We’re used to churn only being positive. How can you lose negative amounts of customers?
But negative churn is measured on revenue. So even if you lose customers in a cohort, if the ones that remain spend more and more than make up for the lost revenue, then you have negative churn.
In practice, this is rare for early stage businesses. But when you have it, it’s golden.
Short-Term vs Long-Term Actions
Beyond the benchmarks above, another reason it can be so unhelpful to take metrics at face value is the difference between short-term and long-term thinking.
Need to show surface improvements to your unit economics before an investor meeting? Easy. Hope that they don’t actually look at the data and do real due diligence or ask real questions and then just:
- Cut all paid marketing, which will of course bring CAC down. Your overall customer growth will also fall, but if you’re not reporting that number, it makes CAC look good. Long-term your top-line growth will suffer. This tactic is often used in bad economic climates when actually, those are the times to continue to invest in marketing. You may even find that paid growth becomes cheaper during bad economies because other businesses reduce their spend.
- Extend incentives to customers to drive LTV up. For example, offer more free months of service or a bonus at the end of the year. Of course, these tactics create costs and make for longer payback periods, but they might not show up in your LTV calculation.
- Spend a ton on paid growth to show a bump in revenue, even if it’s unprofitable. You’d be surprised at how many startups do this.
Case Studies
Here are a few mini case studies of startups I helped through the process to improve their unit economics when raising funding or working to extend runway.
Seed Stage Company. $150K ARR
Two software-enabled physical products for the same customer segment.
- Didn’t know their CAC or LTV when asked but eventually we were able to make estimates from existing data.
- Determined that CAC for one product was dramatically higher than its LTV. Is this a product problem or a customer segment problem? We determined that it was mostly what the customer segment was willing to pay, so we focused on explaining the value proposition and increasing prices.
Series A Company. $450K ARR
This one was mostly pricing related.
- The company charged $50/year for a service that should have been 20x to 50x that. Still, they were reluctant to raise prices. They estimated CAC to be around $1,000. No typo.
- Sticking to a low price meant that non-customers assumed that the product didn’t actually work. It also meant that the company lost money on every sale. They weren’t really thinking about that.
- I convinced them to cut the more expensive customer acquisition and to double their prices. Then to double them again. And again. They’re still underpriced, but in a better spot.
Series A Company. $2M ARR
This company had raised $8M over 5 years but still hadn’t focused on its unit economics.
- Cut unproductive marketing spend on Google Ads, where CAC was equal to LTV but the payback period was 3 years.
- Boosted long-tail content creation as a driver of new acquisitions. The content was written to focus on geographic areas with different regulatory requirements and was written according to a preset format (this was before ChatGPT). As such, this content creation was a fixed cost, but one that would breakeven on the first few sales.
- Cut unproductive product development and focused on selling the existing service. This was a necessary step in this market. After the danger phase, this team will explore new product development again.
Series A Company. $0M ARR
I didn’t work with them but met them multiple times. There was nothing to be done.
- The founders raised over $10M in 2021. Along with that came bad habits and unrealistic expectations.
- There had hundreds of thousands of users, or I should say, people who had signed up. Actual usage was very low.
- There was a product, but I never understood why people needed it. There was a revenue model, but only a tiny fraction of a percent of users buying it (maybe by accident).
- There wasn’t much for me to do except recommend that they keep their burn low. Perhaps the next thing they made would work out. What that thing would be was anybody’s guess.
Unit economics is more complex than it seems. Start working on it to improve your outcomes.
This is enough to get you started. If you want a self-serve way to work through this for your business, read the book Growth Units.