Three recent articles on Poets & Quants caught my eye:
– ‘AI IS DEVALUING THE MBA’: Stanford Students Speak Out On Curriculum Lag & Risk To The B-School’s Brand.
– ‘WE EXPECTED MORE’: Stanford GSB Students Call For Higher Teaching Standards.
– ‘WE’RE NOT LEARNING ANYTHING’: Stanford GSB Students Sound The Alarm Over Academics.
These articles are partly about Stanford and partly about the MBA. But they are all about change and the response to change.
For me, the most surprising finding was that professors send “Room Temp” lists alerting students they will call on in class the next day. One Stanford student explained what that does: “It teaches them that they don’t have to read or prepare before class if they’re not on the list.”
I went to a different b-school at a different time and can’t imagine the situation in those articles. But I also get that profs react to situations where both students and administrations may not support having standards.
Some situations I experienced in b-school:
One stats prof was known as the angry guy. One day he went down the row cold calling students:
“What’s Benford’s Law?”
“Uh…”
“It’s in the textbook!” To the next student: “What’s Benford’s Law?”
“I don’t remember.”
“You didn’t do the reading!” Next student: “What’s Benford’s Law?!”
“I don’t know.”
“You gotta read the textbook! Why didn’t anyone read it?!” he screamed.
But that same prof had us hand calculate each step of a linear regression – something that Excel does instantly. And if you’ve never done it you might have no idea what a regression is and what Excel actually does.
In a popular class with 300 students, there was no “Room Temp” list, but the prof would start by calling five names. If your name was called you were presenting the case, no matter what. When the names were called, everyone else would let out a sigh of relief.
I saw people stand for 45 minutes being grilled on particulars they seemed to know well at the start of the hour.
One time as a student made his case the prof stopped him: “See this guy? He’s going to be an investment banker. At some point you’ll meet someone like this. They will throw you under the bus and expect you to thank them.” Everybody laughed (and nobody complained to the administration).
As it did a generation ago, the MBA will be reinvented again. The previous reinvention moved away from the expectation students would take stable corporate jobs. The current reinvention could be about attitudes/standards and AI.
Is some of the situation in the above articles about the slowness to adapt class material? For the last 2.5 years I’ve required AI in my classes. But that also means that you need to change the class itself. If you just tack on AI to an old course it won’t really work.
Or is some of the Stanford situation what comes to the surface in a time of high unemployment for recent MBA grads? Was the situation there earlier but ignored when job prospects were better?
So many ways to learn today.
Author: Paul Orlando
-
AI Impact in Education
-
The Bat and the Can

If you’ve seen any sports news recently, you probably heard about the new “torpedo bats” the Yankees are using and how well they seem to be working.
It’s a simple redesign. By redistributing weight away from the end, the bat delivers more mass at the point of contact, resulting in farther hits.
The idea came from physicist Aaron Leanhardt, who was working as the Yankees’ hitting coordinator. As he put it: “I think the eureka moment… was when players pointed to where they were trying to hit the ball, and they noticed themselves that that was not the fattest part of the bat.”
What struck me wasn’t just the bat redesign. It was that I had stopped thinking of bats as something that still had room for innovation. The last example that came to mind? The corking scandals from the 1990s and early 2000s. But unlike corked bats, torpedo bats are legal.
Now for the can.
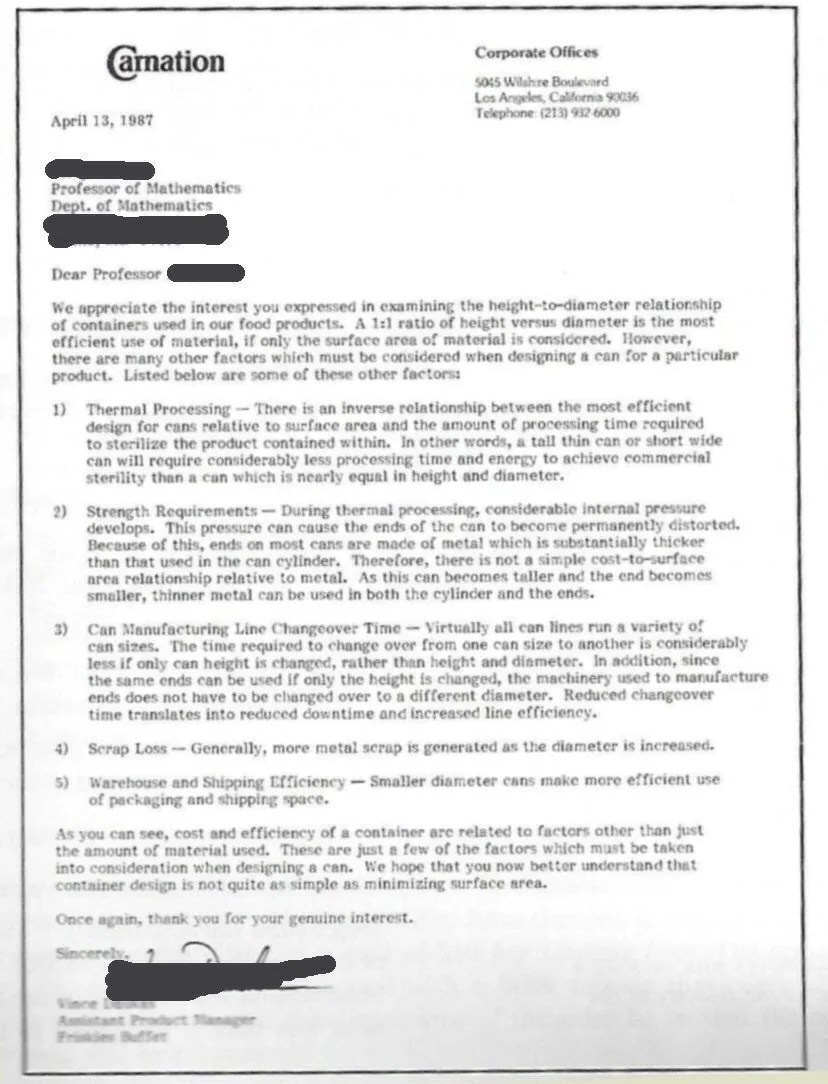
The other half of the title refers to a well-known letter sent by Carnation to a math professor who had proposed a 1:1 height-to-diameter redesign for their cans. His suggestion was to minimize surface area and therefore material use, but ignored other constraints.
“We appreciate the interest you expressed in examining the height-to-diameter relationship of containers used in our food products. A 1:1 ratio of height versus diameter is the most efficient use of material, if only the surface area of material is considered. However…” Then the letter goes on to explain that issues such thermal processing, strength requirements, line changeover time, scrap loss, and more. The solution is not related only to surface area.
The difference between the bats and the can?
In the case of the bats, the innovator started off by knowing the user (the hitters) and then worked with them to create a solution. In the case of the proposed can redesign, the potential innovator lacked that and missed the bigger picture.

-
The Rejection Exercise
For years I’ve been making founders do 30 days of rejection, where they purposely go out and try to get rejected at least once a day. The purpose is to toughen yourself up so you’re not broken by hearing customers / investors / collaborators say “no.”
That’s the general format, but in recent years, I’ve done something different.1) I do the exercise along with them.
2) I use AI to analyze the results (the recent group of 34 founders produced almost 1000 results).
These are the exact steps I used for this one.
1. Provide detailed instructions for how to pursue the rejections, including the document format to save them in.
Rejection Exercise
Rules:
– You must be rejected in person (not online, by phone or remotely) by another person at least once, every day for the next 30 days. Don’t just go through the motions on this. See how you can top yourself each day.
– A rejection counts if you are out of your comfort zone.
– A rejection counts if your request is denied.
– Try different types of rejections, not the same one again and again.
– Do not pursue ridiculous rejections, like “Can I have a trillion dollars?”
– At the time of rejection, you, not the respondent, should be in a position of vulnerability. You should be sensitive to the feelings of the person being asked.
– For this assignment you cannot involve any others in the group, including me!
– Fill out the rejection exercise template.
2. After 30 days, download the results.
3) The AI analysis.
Prompt: Read the attached zipped folder. Analyze the numbered (1 – 30) lists in the docs. Look at columns titled: “What you said”, which is what the people said to get a rejection and “Their response”, which is what the person they spoke to responded with. Make a summary of these exchanges. What patterns do you notice from the exchanges? Which people had the most extreme rejections? Add other things you notice that make sense in this context.
4) What to do differently next time.
– Provide analysis summary beforehand to inspire bigger asks and for context.
– Put instructions in template document (10% changed the filetype, which caused problems.)
– Reward the biggest asks and best rejections.
5) Output: Success rate for different types of asks
-
The “Cold Market” as the next hot market.
Attention flows to hot markets. Depending on when you look around, that could be AI, crypto, web3, climate tech, SaaS, Fintech, metaverse, VR/AR, or whatever’s trending now. But what if the best startup opportunities are actually in cold markets that most people ignore?
I wrote about a version of this phenomenon in my Why Now book, where investors rush into hot markets or, conversely, avoid markets that previously burned them even when the timing is finally right.
But there are some reasons to reconsider cold markets. The best companies often aren’t built in hyped markets. They’re built in ignored ones before they take off.
You’ll also see:
+ Less competition. You’re not fighting multiple VC-backed startups for the same customers.
+ Capital discipline. Less pressure to burn cash just to keep up.
+ Founder attitude. Tougher conditions force better problem solving and creativity.
The trick isn’t just to chase cold markets, but to find cold markets on the verge of heating up. Look for underlying shifts – technological, regulatory, behavioral, or something else (I track 12 timing drivers) that signal a coming change and how those changes can improve the legacy business model.
You also do need to be willing to look foolish or unfashionable for a while. But if you can stomach that, there can be opportunities for you in cold markets. The trick is to find the ones on the verge of heating up.Here’s the list of other Why Now posts. If you like these, check out the Why Now book.
- “Why Now: Timing and Product Success”
- “Avoid the Analysis of Others (Why Now)”
- “Running a ‘Why Now’ Session”
- “50 Timing Examples (the Why Now question)”
- “Measuring Your Market? Consider Timing.”
- “What People Miss About Timing”
- “What Others Say About Timing”
- “The ‘Cold Market’ as the Next Hot Market”
-
More on Gen AI Usage in Entrepreneurship
For the last 2 years I’ve made gen AI mandatory in the classroom, but this semester there were so many useful AI tools and other techniques that I brought them in more heavily.
A few examples from a class of grad students testing and potentially launching new businesses:
Problem: I had the student founders start off with more practice on customer discovery interviews. Many of them have done interviews like this in the past, but I often noticed that they either never knew how to do them well or forgot in the moment. The problem was partially educational, but mainly in terms of getting the practice of how to do them well. And that’s the kind of thing you don’t have enough time for in a class.
Solution: I have founders train an AI to analyze their interview questions and give feedback, specifically looking for common problems like hypothetical questions, forward-looking statements, and more.
Problem: Founders do their discovery interviews and then don’t adequately record responses. As long as I’ve done these I have relied on handwritten notes, whether paper or laptop. But in the past when I sat in on these interviews (pretending to be part of the team) I noticed many different things than showed up in the notes. Also, how do you generate transcripts without spending hours typing?
Solution: Now we record the interviews. I’ve been convinced that enough people have become comfortable being recorded that it’s doing just that. Afterward, we analyze the recordings. Audio alone is fine. That gives a deeper understanding of what people are revealing along the way. And the transcripts can be ~80-90% done with AI transcription.
Problem: How do you really assess whether you have a potential and ready customer? Many times it seems like the founders will just move ahead on anything. That’s actually ok as it’s their decision how to spend their time, but if they want to move in the direction that feedback is guiding them, they should think about what they’re learning through the process.
Solution: For this I use a technique developed by Mike Vladimer and Adam Berk – looking for “people in pain.” Specifically, they recommend building a quantified pain histogram and charting the positive, negative or non-existent pain uncovered. I’ll also be interested to test whether a trained AI is good enough at evaluating these interviews.
You don’t have to use every new tool, but try some of these out. -
What Others Say About Timing
If you’ve been following me here, you know that I spent the last couple years workshopping, speaking, and writing about the impact timing has on the success of a product. In extension of that, the following is an overview of different approaches I’ve found of others dealing with the timing question.
The following is an overview of some of the different timing approaches I found. These and other thinkers, as well as a lot of direct contact with businesses trying out these ideas, helped me make what I believe is a useful book.
And as a result, this is the only book completely focused on how timing impacts a business’s success and what you can do about it. Whether for startups pitching for funding, product people evaluating what to build next, investors making funding decisions, and corporate teams deciding where to put resources… The book provides a way to step through these decisions, successful and failed timing examples, and patterns of outcomes to gain insight.
Each is worth exploring on its own. But I’ll leave that to you. Rather than go into these in the detail they deserve, I’ll leave you with brief introductions here. Read Why Now: How Good Timing Makes Great Products for more detail on many of these. (But really read the book for how you can approach your own timing situation and benefit.)
1. First-mover Advantage / First-mover Disadvantage (Marvin Lieberman and David Montgomery). First-mover advantage was a term casually thrown around starting with the Dotcom era, though the authors never wrote that it existed as claimed. Convince your investors that you had first-mover advantage (in practice just being able to claim that no one else had tried to do the thing… on the Internet).
The joke about first-mover advantage is that the authors of the 1988 paper that popularized the term found that their work had been twisted into all sorts of directions, many of which had nothing to do with their research. On their paper’s 10th anniversary they wrote a follow-up article on first-mover disadvantage and also edited some of their earlier claims.
Those updates gained little attention in 1998. We were moving to the height of the Dotcom / Telecom bubble era back then. First-mover advantage all the way!
2. Adjacent Possible (Stuart Kauffman). Kauffman takes an anthropological approach to this topic. As we invented more tools, those tools could be combined in more ways. Once you reach a certain point, the plethora of combinations leads to an explosion of creation.
Kauffman also provides a formula that describes the phenomenon.
3. Inflection points (Pete Flint). Why do we see rapid growth in certain technologies or industries? Inflection points can explain part of that.
This is something that humans tend to be poor at estimating. We historically experience the world linearly. Day to day changes are modest until… wham! We’re surprised by the sudden explosion of something new.
4. Creative destruction (Joseph Schumpeter). The concept describes the way that innovation destroys the legacy ways of business, along with it the legacy industries, companies, and jobs, and creates new ones.
5. Wheel of Fortune (original meaning, not the game show). The wheel of fortune is the concept that we (individuals or groups) go through ups and downs over time. The pauper turns into the king. The wealthy tribute state turns into the impoverished backwater.
6. Dominant design (James Utterback). How do early industrial decisions constrict later options? The emergence of a dominant design explains some of that. Utterback describes a process where new innovations go through different phases. There is the fluid phase, where new options compete with each other; the transitional phase, where a dominant design wins and businesses now compete to meet demand; and finally the specific phase where innovation is low and the focus is on quality and cost cutting.
Examples include the layout of the Qwerty keyboard (not designed for speed typing), the calculator keypad with its different layout from the phone keypad, and the enclosed steel automobile body.
7. Startup Market Opportunity Curve (Rizwan Virk). Virk explains industry-specific investment as part of a cycle. At the beginning there is lots of risk and little investment which is hard to raise, then lots of risk and lots of investment during which it becomes easier to raise.
The insight is in applying different tactics depending on the stage of your industry rather than consistent tactics throughout.
8. Flywheels (Jim Collins). How you can conceptualize an overall accumulation of effort that produces improving results. Get the flywheel spinning and it helps you spin it faster.
9. Portfolio company study (Bill Gross). This comes from a short TED talk and a couple other references. The founder of Idealab (an early incubator) analyzed 200 companies on the idea, the team, the business model, funding, and timing. Gross then estimated that 42% of company success was due to good or bad timing. He didn’t share his data or process, but it’s an interesting reference point. But contrasting his model and mine, I interpret four out of five of his categories as being related to timing.
To compare, I looked into companies I’ve worked with to see if timing held up as a success or failure factor. It did.
I looked at the largest portfolio of startups I’ve been involved with, from the incubator at the University of Southern California. Of the 168 companies from that portfolio that have been stable enough to survive for at least two and a half years (range two and a half to nine years), the failure rate was 51% for those with a timing advantage but 70% for those without a timing advantage. It was even more extreme in the acquisitions. Eight out of the nine acquired had timing advantages.
10. Installation periods / Deployment periods (Carlota Perez). Perez describes macro forces of government and category investment that lead to innovation, cost declines, and more.
11. The Multigenium (John Lienhard). Inventions come from individuals, but the “multigenium,” the many creations that enable other things to be invented, itself comes from the collective action of many.
12. The Inevitable (Kevin Kelly). Wired co-founder Kevin Kelly introduces a set of 12 inevitable changes we will see in the coming decades.
13. Moore’s Law in Reverse (Alan Kay). Alan Kay, of Xerox PARC describes the process they used to invest in futuristic computers for team members: “run Moore’s Law in reverse.” That is, rather than wait for the performance per cost curve to run its course, pay extra and get that computing power today. On those “machines of the future” you can build futuristic things. If you work with machines of today, you’re really working on technology of the past, which already passed through the Moore’s Law performance improvements.
14. Hype cycle. A visualization of the ups and downs of attention and expectations for new tech, as popularized by Gartner, with the following stages: On the rise, At the peak, Sliding into the trough, Climbing the slope, Entering the plateau.
A few years after the dotcom and telecom bubbles burst I attended a talk by the CTO of a large infrastructure company that saw its stock price skyrocket and then fall back to earth. He spent a lot of time talking about the hype cycle, referencing the railway industry of the 1800s. A nice history to know.
No one asked him why his own company rode it all the way up during the bubble and then all the way down. Not even me.
15. “Cambrian” explosions. There have been multiple eras of explosive creation throughout natural history. The Cambrian explosion was one of those, during which a large number of new species emerged. Why do these diversification periods happen in nature and why in the human-built world?
16. Tech/infrastructure leapfrogging. This largely depends on regulatory, economic, and geographic arbitrage. A common example: in some parts of the world, there never was a strong legacy fixed line telecom network. It was expensive and hard to get a landline.
So when wireless technology became good and cheap, deploying mobile networks and phones leapfrogged over the existing poor fixed line networks. In other countries that had strong fixed line networks, mobile phone penetration took longer. People already had easy telecom access.
17. Crossing The Chasm. Book by Geoffrey Moore that describes the way new products can reach the mainstream market. More about finding the path than timing, but it helps explain why a new product takes time to popularize, depending on the actions of its promoters.
There are more examples I could add, but this gives you an idea. People have been interested in the “why now” question for a long time. I hope that my Why Now book proves helpful as you think through timing and how you will act on it.
Here’s the list of other Why Now posts. If you like these, check out the Why Now book.
- “Why Now: Timing and Product Success”
- “Avoid the Analysis of Others (Why Now)”
- “Running a ‘Why Now’ Session”
- “50 Timing Examples (the Why Now question)”
- “Measuring Your Market? Consider Timing.”
- “What People Miss About Timing”
- “What Others Say About Timing”
- “The ‘Cold Market’ as the Next Hot Market”
-
What People Miss About Timing
They say timing is everything in business. In fact, in a survey of 800 VCs, timing was one of the top reasons they noted behind successful or failed investments. (And though it might seem counterintuitive, being early is often more dangerous than being late.)
But how do you determine if your timing (or “why now”) is right? I set out to learn more through research and testing my findings. Along the way I developed a set of helpful frameworks and a process that I bring investors, founders, and innovation teams through as they consider where to put resources.
Here’s a partial list of some insights and recommendations I developed along the way:
- Look for what I call Timing Drivers. I track 12 types of drivers in a general sense and have teams I work with go into detail for their specific situations. The drivers I track include everything from the Technological (for example, performance curves and cost improvements), Installed Base (critical mass reached in users of supporting equipment and systems), Capital Access (sources and availability), and more. These drivers are a mental shorthand for where to look for environmental changes. These drivers are also most likely changes that are happening outside of your control. Some may have a level of predictability to them, while others may not. You notice change and then put your perspective behind what’s changing.
- Connect the Timing Drivers to your potential business model. Timing Drivers need to improve an existing business model or make a new one possible. Otherwise, you don’t have a timing advantage. You only have a new capability that is at risk of being financially unsustainable. Companies that skip this step can end up wasting the money they raise because what they’ve built may never produce enough value for customers or may never enable the business to capture enough value back from their customers.
- Timing shifts your market size. If we’re not simply evaluating an unchanging, well-understood market, then we should think differently about the role that timing has in potential market size. Too often we look at markets as being measurable and static or as undergoing dramatic growth, but don’t understand what produces that static or dynamic market. Timing plays a part here. In the year 1900 you can’t estimate the market for cars by extrapolating from the existing number of horses.

- There are “Timing Patterns” we can learn from. These are repeated combinations of timing drivers that offer us examples to learn from. I’ve written about some of the most common I’ve observed. These patterns help give us a starting place to look for potential timing advantages.
- Run “Why Now Sessions” and build “Timing Maps.” These are processes and tools I developed to conduct a structured evaluation of a market and industry to identify whether this is a promising time for a specific concept. The Timing Maps visually represent the factors influencing your timing decision.
- Don’t simplify too much. For example, while people often say you should “sell shovels in a gold rush,” think about what type of situation you’re actually in. There are different types of allegorical shovels you can sell, just as there are times when it is more beneficial to mine for the gold. The original discoverer of gold at Sutter’s Mill, James W. Marshall, died penniless. So did Samuel Brannan, the proprietor of the only general store near Sutter’s Mill (he sold lots of shovels). But one seller of “shovels,” Levi Strauss, the first manufacturer of tough denim jeans, did much, much better. Consider which shovel seller (or gold miner) type you might be.
- Consider how early you should enter. This depends on how long you expect it will be for the market to be ready, just as it also depends on the type of organization you are. Are you able to build quickly and benefit even if the market window may quickly shut? Or are you better off watching first entrants, learning from their mistakes, and then entering? This requires you to evaluate your own business as much as it requires an analysis of the external environment.

- Remember that first movers usually fail. If you plan to be a first mover, can you control resources to make it more difficult for later entrants? Can you lock in customers? If not, what will prevent later entrants with better products from overtaking your business? Too often, in our excitement to enter a new market, we don’t consider these long-term questions.
As you can see, there are many timing-related considerations. I spent the past few years focused on the timing question and issues like those above and distilled my findings into a concise, practical book. The book is called Why Now: How Good Timing Makes Great Products.
This book is your guide to understanding the drivers of good timing, the impact timing has on business models, and how to apply these insights to your unique situation. Whether you’re an investor, founding team, product manager, or part of an innovation group, this book offers valuable frameworks and real-world examples to evaluate and leverage timing in your ventures. I hope you enjoy it.

Here’s the list of other Why Now posts. If you like these, check out the Why Now book.
- “Why Now: Timing and Product Success”
- “Avoid the Analysis of Others (Why Now)”
- “Running a ‘Why Now’ Session”
- “50 Timing Examples (the Why Now question)”
- “Measuring Your Market? Consider Timing.”
- “What People Miss About Timing”
- “What Others Say About Timing”
- “The ‘Cold Market’ as the Next Hot Market”
-
Measuring Your Market? Consider Timing.
10 years ago today, NYU finance professor Aswath Damodaran, well-known for his work on corporate valuations, posted an article on Uber. The rideshare company was already a unicorn (a new term at the time), with a $17B valuation.
Yet, Damodaran ran the numbers and came up with a more modest $5.9B valuation. The title of his post, “Uber Isn’t Worth $17 Billion” summed up his thoughts. Lest we forget, many others back then also thought that companies like Uber (as well as other unicorn startups) were overvalued.
A month later, Uber investor and board member Bill Gurley posted a rebuttal. In “How to Miss By a Mile,” Gurley laid out an argument for Uber’s valuation.
But you have to appreciate Damodaran’s analysis. He showed his work and provided his Excel model. Gurley, on the other hand, revealed fewer numbers or didn’t want to share specifics for a then-private company.
To be fair, Damodaran had to rely on public information where Gurley had insider knowledge. But the main difference between the two approaches was on whether the world would remain the same in the future related to local transportation (the Damodaran model) or whether the world of transportation would change in a meaningful way (the Gurley model).
But how could you ever know if the world is ready for change or if things would largely remain the same?
Questions like that involve the role of timing.
Timing Changes The Market Size
As part of his process, Damodaran estimated the market size of the global taxi industry. He summed up measures of the largest taxi markets in the world (Japan, UK, USA) as $50B and doubled that for the rest of the world. This estimate came to $100B/year, with the large markets like the US stable and real growth coming from emerging economies. He averaged annual growth at 6% / year, meaning that the taxi market that he put Uber into was projected to grow to be $183B by 2024.
Among the logical mistakes I believe Damodaran made was in believing that (as he wrote): “Unlike technology companies in other businesses, like Google, Facebook and eBay, the network effect and winner-take-all benefits are limited. Having a global network of tens of thousands of cabs doesn’t make a difference to a customer looking for a cab in New York City. That, along with the regulatory restrictions protecting the status quo and the competition Uber faces from Lyft, Hailo and others, lead me to estimate a market share of 10 percent.”
Let’s look at why these assumptions proved to be incorrect.
Uber didn’t immediately roll out drivers around the world. They intentionally rolled out new geographies when they could manage (and create) supply and demand. There are winner-take-all benefits even for rideshare, whether from the view of passengers (don’t need to find the local rideshare app for each trip) or from the view of the rideshare companies (accrued benefits to the tech, mapping, funding of new market expansion).
Damodaran also overestimated how much power municipalities had to prevent Uber from entering their cities. Uber’s tactic here was to enter without permission, provide service better than the baseline taxi companies, gain passenger support, and then negotiate with municipalities that wanted to force them out.
In his model, Damodaran took the 10 projected years of free cash flows, the estimated terminal value after year 10, assumed that Uber would cap out at 10% of the overall market size, and that it would take 10 years (that would be 2024) for the company to reach that stable state.

Way too small to read as an image. Check out the actual spreadsheet.
When it came to VC Gurley’s rebuttal, he used this short description of why projections can mislead.
Seeing that Tweet, I looked at the markets for horses and cars when doing research for my Why Now book. It tells the story. The market for cars does not cap out at the size of the previous market for horses. Rather, the market for cars becomes much bigger than the market for horses. The market for cars opened up new transportation possibilities.

Gurley focused on some key differences between the legacy taxis and new entrant Uber. With Uber, pick-up times were faster, there was improved “coverage density,” or the ability to grow the service area, there was no need for cash payment, having driver and passenger ratings produced better behavior, and resulted in higher trust and safety.
Gurley claimed that Uber was highly price elastic, meaning that as it lowered its prices, more people would choose it, even choosing it over other options, such as not traveling at all. When Uber would start to strategically alter its pricing, it would benefit from that price elasticity.
Gurley provided other use cases in Uber’s favor, but stressed the potential for the company to be an alternative to owning a car. In the US, few cities have such good public transportation as to eliminate the need for a car if you could afford one. But Uber’s entrance potentially does just that.
Interestingly, Damodaran’s 2014 estimates of what the taxi market size would be in the year 2024 ($183B) wasn’t that far off from more recent estimates ($230B in 2023).
However, the sum of the taxi and ride-hailing markets became about twice what Damodaran estimated for 2024.

Uber’s market share of the combined ridesharing and taxi market ended up being 25% globally, as opposed to Damodaran’s assumed 10%.

Since those previous projections are now history, I used Damodaran’s model and plugged in the actual numbers for 2014 – 2024 for the taxi and ride-hailing markets and increased Uber’s market share to 25%. Writing in 2014, Damodaran obviously didn’t factor in a market decline for Covid. So I went back and smoothed the growth rate for the years 2020 to 2024.
Damodaran’s valuation after those changes? $28.4B, or almost five times his original estimate. Uber’s last valuation before IPO was $80B. Current market cap is $135B.
But what changed the market size? I think about this in terms of timing.
The general process I follow is to look for Timing Drivers (there are 12 I consider), to understand how those Timing Drivers impact the company’s business model, and then to consider what company is best positioned to take advantage of those changes.
Rideshare businesses only because possible around the year 2009 or 2010 when Uber launched. Timing Drivers that enabled their existence included critical mass of smartphones with GPS chips that were fast enough to provide turn-by-turn directions, user comfort with online payments and ratings systems, and gig economy demand. While pieces of those Timing Drivers existed earlier, their combination was essential.
Those Timing Drivers combined to enable a new business model. Namely, a business model where Uber could provide higher value to customers (clarity on when a car will arrive, driver trust, no need to carry cash), revenue for the business (charging passengers’ credit cards), and lower per ride costs (car and fuel costs are pushed to the drivers, while Uber provides the overall system).
Avoid Damodaran’s mismeasurement. Go through what I call a Why Now Session to evaluate the future potential for a new business or evaluating whether it’s the right time for a specific product or service to grow. I describe the process, with frameworks and examples in the book Why Now: How Good Timing Makes Great Products.

Here’s the list of other Why Now posts. If you like these, check out the Why Now book.
- “Why Now: Timing and Product Success”
- “Avoid the Analysis of Others (Why Now)”
- “Running a ‘Why Now’ Session”
- “50 Timing Examples (the Why Now question)”
- “Measuring Your Market? Consider Timing.”
- “What People Miss About Timing”
- “What Others Say About Timing”
- “The ‘Cold Market’ as the Next Hot Market”
-
Surviving the Investment Climate with Unit Economics
(For a full walkthrough of unit economics, read the book Growth Units.)
Those days of easy money, unprofitable growth, fast closes, and record-breaking valuations are over. For a while.
If you’re running a startup that is still making its way toward financial sustainability and Product Market Fit, what do you do now to improve your odds of being able to raise your next round? Or to improve your ability to extend your runway? And to prove that your startup will survive long-term?
You probably need to improve your unit economics — the performance of your business’ customer acquisition cost and customer lifetime value and the balance between them. If you don’t really know what that means, haven’t spent much time working on improving your unit economics, or aren’t sure how to start, you’re not alone. Most startups I talk to are in the same situation.
I actually find that the definition of unit economics varies from person to person. After working with lots of startups on this, I think of the unit as the customer, not the individual sale of one item. The customer is the reason the business exists. Understanding what contribution margin each purchase (of which they may be many) that the customer makes, plus the cost to acquire that customer, is the key. If you only think of a unit as each individual purchase, it skews your thinking to the short-term.
This is some of what I’ve learned from working with lots of startups and teaching the unit economics topic at university. (This post assumes some knowledge of unit economics.)
Awareness Levels
When it comes to unit economics I find different levels of awareness from founders and executive teams.
- (Level 0: Doesn’t know what the question means.)
- Level 1: Can give a basic answer, like “Our CAC is $50,” or “LTV is $1,000.” But they figure this out by just taking last month’s marketing spend and dividing it by the number of new customers. Or they take an assumed churn rate and divide that into their per customer contribution margin (or worse, revenue). When I hear single numbers, I know that they haven’t gone into detail yet.
- Level 2: Can answer the question on a per channel basis for CAC and a per segment basis for LTV. Can tell you how much they’re putting into each channel and what retention is like per segment.
- Level 3: The above and they’ve experimented with their pricing, are tracking cohort metrics and trying to improve them, they know the different expected retention behavior per segment. Knows industry benchmarks.
- Level 4: They have expectations for how things will change as they put more into specific channels (CAC goes up/down by how much? When will a channel likely stop performing?) They’re experimenting with how to change the product to drive LTV or shorten payback periods. Knows that they shouldn’t simply aim for industry benchmarks.
- Level 5: Looking for ways to defend or build a moat in order to protect what they’ve gained above. Understands the overall system.
Figuring out the above is a process and takes time. Companies I’ve helped certainly need months (and the process of improvement actually never ends). Once you make some progress, you’ll be in a much better place to pass through due diligence and raise your next round or become financially sustainable sooner. But here is a general process I follow.
The General Process
In the beginning, I like to get to know the startups first, what they are building, what their goals are, their value proposition, customer targets, and more.
But the general process I follow is this:
- Stop the bleeding. Cut unproductive marketing.
- List the CAC channels and the CAC for each. Or figure this out if it’s not known.
- List the customer segments and the LTV for each. Or figure this out if it’s not known. This takes more time than figuring out CAC since some time must pass to understand likely customer behavior.
- Understand how the above two points fit together.
- Discover current benchmarks that the company may be measured against, whether by industry, company type, or current investment/economic environment. This is sometimes a moving target.
- Talk the team off the ledge when things look tougher than they thought.
- Develop leading indicators to help project future results.
Benchmarks
In times of low, low interest rates -> growth is the priority.
But in times of higher interest rates (at least by recent historical standards) -> profitable growth is key.
That means that now (2023), in a time of higher interest rates and more cautious investing, showing strong fundamentals is a better strategy.
Related to the above, you should be aware of various benchmarks that exist for companies in your industry and stage. Where do these benchmarks come from? Not some totally objective source. Rather, they typically come from what investors, advisors, and others in the startup world see and their general expectations for what “good” performance looks like. These benchmarks change over time.
Here are some to know.
Payback Period
This is an important metric for me. Payback period is the time it takes for contribution margin generated by customer payments to pay back your CAC.
For example:
If CAC is $100 and LTV is $500, how long does it take you to collect that $500? Are you projecting $10/month for 50 months? If so, your Payback Period is 10 months ($100 = $10 x 10 months).
Many startups have much longer Payback Periods. Longer payback periods can come from being inefficient at customer acquisition and paying too high of a CAC, not charging high enough prices, not charging at all for some users with freemium models, low retention, and more.
If you can shorten your Payback Period, it’s a magical thing. Imagine the extreme case of being paid back right at the beginning. You can put that money into the next customer acquisition.
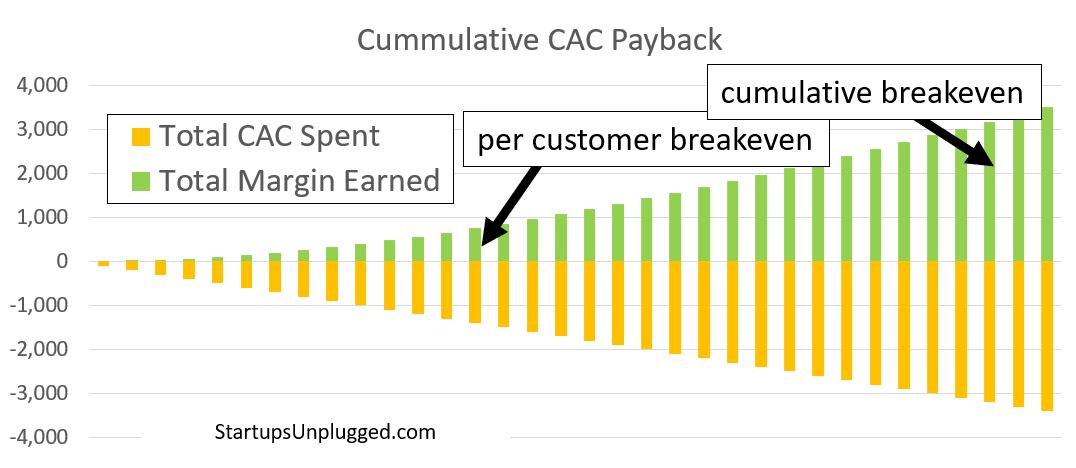
That’s payback period on a per acquisition basis. What about in the aggregate? As in, if we keep spending on customer acquisition up front, but only see the returns over time, how long do the losses accumulate before we start to be net positive?
This is where startups can grow themselves broke. Here’s a simple, but rosy scenario of a company that continues to invest in new customers at the same rate: CAC is $100, the company earns back $10 in contribution margin each month, and retention is 95%. These numbers are likely to change all the time (or at least CAC and retention), but this will give you an idea. If this rosy scenario without even considering discount rates is tough, what will your situation be?

In the chart, per customer CAC payback takes 14 months (which for many funded startups would be very fast). But the key is that since the company must keep spending each month, the losses accumulate until enough customers have paid off their CAC. Keeping the same pace throughout the process, it’s not until month 32 that all spending on customer acquisition breaks even. That means that the business must be able to lose money until month 32 in order to maintain this pace of acquisition. (We’re also ignoring other costs not counted in unit economics here, so the situation is even bleaker.)
What can you do if you can’t wait that long? Improve retention, lower CAC, increase contribution margin, and spend less.
Rule of 40
Another benchmark that’s used today is the “Rule of 40,” mostly used with software and especially SaaS businesses that have some level of business maturity or predictability, often at least at $1M MRR (monthly recurring revenue). I’d say that it’s certainly talked about at businesses with less revenue than that. This rule is measured as:
Revenue growth as a percentage + Profit margin (various types are used)
And with the target being 40% or higher.
This is a good heuristic, but of course you have to dig deeper.
First, there are a number of ways to get to 40%. Each tells a different story.

Rule of 40 measures the Revenue growth rate + EBITDA (or sometimes Operating Profit) margin. Below I just call it profit margin. The benchmark is for the total to be 40% or greater. Blue is Revenue growth. Green is EBITDA margin.
1 and 2 (Revenue growth is dominant). In these two, revenue growth rate is greater than EBITDA margin. That represents companies that are growing revenue quickly, but for which that growth may not be profitable.
3 and 4 (profit margin is dominant). In these two, profit margin is greater than the Revenue growth rate. That represents companies that are becoming more profitable, but for which that profitability may be holding back their top-line growth.
5. A balance between the two.
6 and 7 (Decline in one of the two inputs). In these two types, one of the two metrics, Revenue growth or profit margin are declining, but the other one makes up for that decline, for the purposes of the Rule of 40 metric. That can represent a problem or changes within the organization. For example, #6 could represent a company that has figured out how to grow revenues but by adding team members or spending a lot more on customer acquisition. That could be OK in the short run as long as the business can become more efficient later. #7 could represent a company that has chosen to eliminate unprofitable customers. Can it make up for that revenue loss by focusing on another customer segment?
Early on, you might need to have a negative profit margin. It’s even expected for early-stage companies that are in theory scalable.
Early on, you might also need to experiment with the product, pricing, targeting, and more. In the process, revenue can suffer. But that’s part of the process of figuring out your business model.
And early on, you might expect that your revenue growth should be the main driver of this metric (numbers 1, 2, and 6 above).
And another way the Rule of 40 can be misleading is with the percentages themselves. Imagine a small startup with only $10,000 in Revenue (it happens). If they double that to $20,000, they’ve just grown the left half of the calculation by 100% without meaningfully impacting the business. That’s why this rule has to be used carefully (or not at all) with early stage companies.
Using this rule with later-stage businesses (or even public companies) means that you would use annual numbers for the revenue growth percentage. But for an early-stage business, revenue growth could be at 10x or more per year. If you were to use the Rule of 40 with an earlier-stage startup, using monthly or quarterly growth would be more appropriate.
Know that investors may look to the Rule of 40, but also know that it’s not the single metric to optimize for when raising capital. A survey of 200 software companies showed that only around one-third maintained this, with only 16% exceeding the metric. Where did this rule come from? Apparently, just one board meeting.
CAC to LTV Ratio
This is another benchmark that you hear a lot. And the standard ratio you hear for CAC to LTV is 1 to 3 or 1 to 4. That is, for every $1 you spend acquiring a customer, you should earn $3 or $4 back.
This is helpful, but can be misleading for a few reasons.
- First, where does that multiple come from? Why not just aim for anything better than 1 to 1? The buffer is there because LTV doesn’t represent all the costs a business incurs in order to gain and serve customers. There are other expenses, like rent, non-marketing or customer-facing employees, healthcare, insurance, etc that don’t get counted in gross margin. The buffer gives the business some room to still be unit profitable.
- The second reason is payback period, as described above. If you have a lot of money flowing out the door on customer acquisition and time before you get paid back, you probably want multiples of it on the return trip.
- Early-stage startups often don’t hit this ratio. They sometime have to pay higher CAC and they often have low or even negative LTV as they improve the product. As long as they’re improving, this doesn’t have to be a problem.
- But the third reason is that it’s just too simple. It’s a standard benchmark that came to be used. You should reevaluate it depending on your goals. For example, if you’re after market share, then you could run a ratio closer to 1 to 1. If you’re not interested to grow at this time, but want more profitable growth, go higher than 1 to 4.
Before investors ask about your CAC to LTV ratio, think about a few things:
- Where you are today is not the long-term. Your CAC may be expensive in the beginning as you figure out who your idea customers are, how to target effectively, and build referrals. I often see per channel CAC start high, then decline to a point at which its profitable, and then increase again as you run out of targets in the channel. As you move through that curve you need to add new, more profitable channels of acquisition and also figure out how to generate customer referrals.
- Estimate where you could bring these metrics long-term. How would LTV change as you improve the product, increase retention, extend the product line, and reduce per unit costs? Pitch that future state rather than the current state.
That cumulative CAC payback chart from above? Those customers are well below the 1 : 3 ratio.
PMF Engine
The term “product-market fit” gets thrown around a lot. People use different, vague definitions for it. I’ll summarize it as having a product that can grow profitably (doesn’t sound as impressive as “PMF” though). That means people want what what you have.
Having PMF (or being close) is something that helps along the way to good unit economics.
But how do you know you’re on the right track? What leading indicators could you use to help?
For this, I have to give full credit to Rahul Vohra, the founder of email service Superhuman.
If you’re building the right thing for the right audience his “Product Market Fit” Engine is a way to figure this out. You can watch a video of him speaking about it, but the basic steps are:
- Survey and interview existing customers to understand what they value and to learn about new market segments.
- Segment the customers into ideal and non-ideal customer personas. Measure how well you’re satisfying their needs.
- Analyze what the ideal personas value in your surveys and interviews.
- Improve the product for the ideal personas based on what you heard from them.
- Experiment with secondary persona preferences to expand the product line.
You can track how well you perform on these activities as a way to measuring PMF. Is this exactly unit economics? No, but the process will help you know how well you’re serving the right customers. That in turn connects to your ability to retain them, charge more, and expand your offerings.
Negative Churn
Another metric people love to talk about is negative churn.
Negative churn sounds impossible. We’re used to churn only being positive. How can you lose negative amounts of customers?
But negative churn is measured on revenue. So even if you lose customers in a cohort, if the ones that remain spend more and more than make up for the lost revenue, then you have negative churn.
In practice, this is rare for early stage businesses. But when you have it, it’s golden.
Short-Term vs Long-Term Actions
Beyond the benchmarks above, another reason it can be so unhelpful to take metrics at face value is the difference between short-term and long-term thinking.
Need to show surface improvements to your unit economics before an investor meeting? Easy. Hope that they don’t actually look at the data and do real due diligence or ask real questions and then just:
- Cut all paid marketing, which will of course bring CAC down. Your overall customer growth will also fall, but if you’re not reporting that number, it makes CAC look good. Long-term your top-line growth will suffer. This tactic is often used in bad economic climates when actually, those are the times to continue to invest in marketing. You may even find that paid growth becomes cheaper during bad economies because other businesses reduce their spend.
- Extend incentives to customers to drive LTV up. For example, offer more free months of service or a bonus at the end of the year. Of course, these tactics create costs and make for longer payback periods, but they might not show up in your LTV calculation.
- Spend a ton on paid growth to show a bump in revenue, even if it’s unprofitable. You’d be surprised at how many startups do this.
Case Studies
Here are a few mini case studies of startups I helped through the process to improve their unit economics when raising funding or working to extend runway.
Seed Stage Company. $150K ARR
Two software-enabled physical products for the same customer segment.
- Didn’t know their CAC or LTV when asked but eventually we were able to make estimates from existing data.
- Determined that CAC for one product was dramatically higher than its LTV. Is this a product problem or a customer segment problem? We determined that it was mostly what the customer segment was willing to pay, so we focused on explaining the value proposition and increasing prices.
Series A Company. $450K ARR
This one was mostly pricing related.
- The company charged $50/year for a service that should have been 20x to 50x that. Still, they were reluctant to raise prices. They estimated CAC to be around $1,000. No typo.
- Sticking to a low price meant that non-customers assumed that the product didn’t actually work. It also meant that the company lost money on every sale. They weren’t really thinking about that.
- I convinced them to cut the more expensive customer acquisition and to double their prices. Then to double them again. And again. They’re still underpriced, but in a better spot.
Series A Company. $2M ARR
This company had raised $8M over 5 years but still hadn’t focused on its unit economics.
- Cut unproductive marketing spend on Google Ads, where CAC was equal to LTV but the payback period was 3 years.
- Boosted long-tail content creation as a driver of new acquisitions. The content was written to focus on geographic areas with different regulatory requirements and was written according to a preset format (this was before ChatGPT). As such, this content creation was a fixed cost, but one that would breakeven on the first few sales.
- Cut unproductive product development and focused on selling the existing service. This was a necessary step in this market. After the danger phase, this team will explore new product development again.
Series A Company. $0M ARR
I didn’t work with them but met them multiple times. There was nothing to be done.
- The founders raised over $10M in 2021. Along with that came bad habits and unrealistic expectations.
- There had hundreds of thousands of users, or I should say, people who had signed up. Actual usage was very low.
- There was a product, but I never understood why people needed it. There was a revenue model, but only a tiny fraction of a percent of users buying it (maybe by accident).
- There wasn’t much for me to do except recommend that they keep their burn low. Perhaps the next thing they made would work out. What that thing would be was anybody’s guess.
Unit economics is more complex than it seems. Start working on it to improve your outcomes.
This is enough to get you started. If you want a self-serve way to work through this for your business, read the book Growth Units.
-

50 Timing Examples (the Why Now question)
If you’re finding this post now, I actually wrote a book about all this… It’s called Why Now: How Good Timing Makes Great Products. You’ll get a fuller perspective there.
In the last few posts I introduced the idea of why timing is important, the 12 timing drivers I track, and why you can’t just use analyst reports to figure things out. I also showed how I run “Why Now” sessions.
Now let’s look at the way people have presented timing advantages. Below is a collection of:
- Why Now slides from pitch decks (26 examples)
- Sequoia startup founders on the Why Now question (6 examples)
- Interviews with founders, investors and more about timing (12 examples)
- Weak Why Nows and companies that failed because of or in spite of timing (6 examples)
Why Now slides from pitch decks
I believe that your perspective on timing is one of the most important pieces of insight you can bring to the discussion with an investor or when discussing resources and direction internally.
As I demonstrated in the earlier posts above, you need to do your own research to have a perspective. And while you’ll summarize your timing advantage in a single slide, you should start with that more detailed research. Otherwise, you won’t be able to answer investor and management questions (and your slide will be superficial).
Powerful startup Why Now slides explain why this business is in the market at the right time (and why a few years ago would have been too early). What has changed? What timing drivers opened up a market window that the startup is now exploiting? The slide is typically placed after the problem and solution slides.
This is a collection of slides from actual startups, all publicly available online. I show just the relevant slide the company used in their deck and also add a quick assessment.
I take the slides at face value but I’m not claiming that these examples are perfect. In some cases I critique them or question the assessments. This is an exercise to understand how startups expressed their own timing advantage. In some cases, I show how the Why Now assessment ended up being incorrect.

The images link to the full decks.
AdPushup

Comments: This slide relies on analyst forecasts and (at the time) hotness of the adtech market. If you can move fast, you might be able to take advantage of a hot market. But if things outside of your control change, what do you do then? Think a step earlier to what drives the expected growth. The A/B Testing comment is more focused on open space in a market where experience from another market can be applied.
Bliss AI

Comments: Interesting from today’s perspective that Bliss AI was focused on remote work back in 2015 and listed a projection for the year 2020. Rather than use projections of how big remote work would become, think about what drives the change.
Crossbeam

Comments: This is a list of strong drivers that demonstrate why the time is right. The slide also shows how the drivers collide to produce an even stronger effect. Go into more detail on expected growth in due diligence.
Databricks

Comments: Connecting the need to build AI/ML solutions with these four categories makes this a strong slide. The commoditization category is especially interesting.
Dropbox

Comments: Good list. In discussion, the founders can explain just how cheap storage and bandwidth have become (this slide is from 2008) and how that makes a new business model possible.
Dutch

Comments: Good assessment of what changed because of the pandemic, how that impacts pets, and what will further change when people go back to the office rather than work at home.
Enduring Planet

Comments: This startup makes make rapid financing available to climate entrepreneurs. Is the focus on the interest in climate change enough of a timing driver? They also provide a simple diligence and investment process which isn’t common. Could they claim that tech also adds to their “why now”? This is one of the simplest Why Now slides I’ve seen. It could go a lot further.
Fivetran

Comments: Good list, but what is changing with these tech drivers? Why wouldn’t this business have worked a few years ago?
Glambook

Comments: Rather than quote a projection, what drives the increase in self-employment for their targets? It’s unclear what will change by 2027. Weak slide.
Harvest Money

Comments: Do these numbers represent a tipping point? Were the debt numbers of a few years earlier too low for this business to be built? Otherwise, if it didn’t matter in the last recession, why is it different now?
Kahani

Comments: Might be a good opportunity, but I’m not sure about the why now claims. Why did mobile ecommerce survive so long without changing? Seems more about straightforward performance of this solution. Why are ecommerce sites going to change now?
Lunchbox

Comments: The driver is entirely about existing and projected market size. What else is relevant here? Why will this market growth continue? Will growth continue post-pandemic?
Lunch Club

Comments: It’s a list, but if these changes have been ongoing, why do they matter now?
MetaCert – In-App Security

Comments: Interesting point that thanks to the growth in DIY app builders there will be demand for security, or at least fixing security problems. (But if the point is that creation is exploding, I don’t see it in the image.)
MetaCert – Team Collaboration Security

Comments: This would be stronger if it explained how this risk is growing. Haven’t companies dealt with this security risk for years at this point? What changed? Was a tipping point reached? A regulatory change?
Momentum

Comments: This slide is from 2022 and so it leaves a lot unsaid. Remote work and reliance on remote tools are now norms. Did this business require the Covid push to remote work?
National Virtual Observatory

Comments: Strong. These changes enable this business (slide is from 1999). Without these timing drivers the outcomes would be dramatically more expensive and less powerful.
On Deck

Comments: Strong list that supported their fundraising efforts in 2021. But did traditional higher education really decline as ed-tech grew? And while that Peloton example stings from the viewpoint of 2022, it did the job then they wrote this list. A strong Why Now also doesn’t mean that the team won’t mismanage their opportunity later on.
Party Round (now called Capital)

Comments: A simple slide that tells the story. Verbally fill in the details about how fast these alternatives are growing.
Shift

Comments: If the used car market has doubled in the last decade, will growth now slow down? Is the online research done more often today than previously?
Snyk

Comments: Good combination of timing drivers. The “New Kingmakers” one is interesting because it combines existing tech talent with a new responsibility.
Standard Treasury

Comments: Simple list. The big question is whether the company can move in line with the regulatory changes. What else about the tech maturity and growing market would be relevant?
Sunshine

Comments: The biggest timing driver here is the increase in smartphones with built-in sensors.
Supliful

Comments: These may be facts, but what changed? Was there a tipping point reached in number of creators? Did creators become more relatable than brands just recently? Otherwise, it seems that this business could have been started years earlier.
Vori

Comments: Many startups benefitted (or suffered) because of the sudden onset of Covid, lockdowns, and supply chain problems. If a business happened to be well-positioned to benefit from such changes or was able to adjust quickly, this crisis provided a strong timing advantage. The question is then what happens when things go back to the way they were?
Yapily

Comments: This is a full look at drivers behind this company’s existence. The main one is probably the regulatory change.
Here’s a breakdown of each of the above slides, by the 12 timing driver categories I track.

Sequoia Portfolio Company Interviews
The following are interviews focused on the startup “why now” question that Sequoia investors did with their portfolio companies. Snippets of the conversation are below along with video links. These are all from 2018. The update comments are limited to additional funding rounds or acquisitions as a sign of whether the companies continued on the right track.
Wonolo (on-demand staffing for businesses)
“The problem of unpredictable staffing has been around forever. It’s not new. What’s new is that with the increasing adoption of mobile technology and the rise of the on-demand economy, we’re seeing a paradigm shift in that people are trusting an app to find workers and jobs.”
Update: Raised $140M in 2021, a few years after the above.
Front (customer communication platform)
“Before, companies were just using email to get organic and now they have Twitter and Facebook and Snapchat and text messages and so on. So they need to centralize everything in one place because those are just different ways to do the same thing: communicate. And that’s what Front does.”
Update: Raises a Series D at 1 $1.7B Valuation in 2022.
rideOS (mobility-as-a-service technology).
“As you look back at transportation over the last few decades, there’s been three megatrends that are completely changing the way that people and goods move throughout the planet. The first one was electrification. We had great companies like Tesla bring that technology to market. The second one was ridesharing and concept of sharing cars. And companies like Uber, Lyft, and Didi brought that technology to market. And a third one has been autonomous technologies. How to effectively utilize technology to drive on the road. And there’s been significant investments into the third bucket over the last few years. But most of that investment has been focused on how to get one vehicle to market. As we look towards the path that this technology is taking and we look at a world that is filled with millions of self-driving vehicles and other forms of transit, like buses, and MRT stations, and taxis, and also other forms of transport, there needs to be a type of air traffic control system for ground transport. And that’s where rideOS comes in. We’re looking at the problem of taking fleets to market and building marketplaces and mapping services to help bring that system to the world in a safe and efficient manner.”
Update: Acquired by Gopuff for $125M in 2021.
Cobalt Robotics (after-hours security robot service)
“We’re at a unique time in technology where we have all these amazing component technologies that are very cost-effective today. To basically be able to allow an autonomous mobile agent to move very reliably and very safely through human spaces. That’s something that just wasn’t possible 10 years ago that is now very much achievable.”
Update: Raised another $35M in 2019.
NEXT Trucking (digital marketplace for trucking)
“90% of our industry is comprised of small trucking companies, either owner operated or small fleet. Lack of transparency and yield mandates actually make our existing trucker shortage problem more severe now. And NEXT Trucking actually increases our carry efficiency by connecting them with their preferred loads and then we also help our industry supply and demand.”
Update: Later raised at a $500M valuation in 2019.
Snowflake (cloud computing)
“Because it really wasn’t possible to build Snowflake before now. The cloud made Snowflake possible and with Snowflake companies can work with vast amounts of data. And all of the people within an organization and even across organizations can work together.”
Update: Later raised another $480M and then IPO’d in 2020.
Interviews and Articles
This is a collection of interviews and articles where the timing question comes up.
Torc Robotics
“Why now for the automotive push? Torc CEO Michael Fleming told me that the time is finally right, both in terms of the state of available technology, but also in terms of the appetite for autonomous products from consumer automakers — which weren’t always as eager to develop and invest in self-driving.
“What we’ve found is that were some other markets that were early adopters to this technology, and there wasn’t a great deal of interest in the automotive industry coming out of the DARPA Challenge,” explained Fleming. “Google is really the early adopter of this technology, with some key folks from the Carnegie Mellon and Stanford teams from 10 years ago, and they’ve done some great marketing, and they’ve been on the forefront of this technology in the automotive space.”
Comments: The timing question here refers to Torc’s push into automotive, having already built other autonomous applications.
“Regulations can define the best places to build and invest”
“In April, the White House announced a target for the U.S. to reduce greenhouse gas pollution by at least 50% by 2030 and achieve net-zero emissions by 2050. The guidance includes a vision for more investment in building a transmission grid, electric vehicles and charging infrastructure, and carbon capture tools, and enabling farmers to foster sustainability in soil.
“In aggregate, the support of the public sector streamlines private-market solutions through access to alternative (often equity-free) capital and press recognition, which is crucial for a market that typically requires longer time to monetization and profitability.
“Ultimately, the regulatory fabric is an important market maker or breaker. That is true for nascent companies searching for answers to the “why now?” of market timing and also for established, public companies that are answering strategic questions of how much more they can grow.”
Comments: Regulations and top-down support are an influence on timing advantages.
“4 strategies for deep tech founders who are fundraising”
Answer the question of “why now?”
“Being right but too early or too late is the same as being wrong in the investing world. Early-stage venture capital investors operate on seven to 10 year time horizons with their investments because that is the timeline they have for each fund to return capital to themselves and their limited partners (those who invest in venture capital funds). If your company can only be a huge success 15 or 20 or 50 years from now, venture capitalists would still not invest because this return would not be realized on their target timeline.
“As a result, it is crucial to discuss not only why your idea is great but also answer the “why now.” Deep tech companies have more of a why now than companies in most other sectors. There are technological inflection points and regulatory tailwinds that make the timing perfect for deep tech companies.
“Dedicate a slide to explaining how macro and industry level tailwinds make now the ideal time to start your company. Articulate why your innovation could not have been achieved before today and why tomorrow would be too late.”
Comments: Framing timing in the seven to 10 year investment horizon is interesting. It’s also a reason that startups needing more time need to seek different investors.
“General Catalyst’s Niko Bonatsos on why timing and empathy are key to founder success”
“Q: If you were to pick one and only one single biggest factor that determines a startup’s success, what would it be? Why? Some say it is product-market fit (Marc Andreesen), others hold that it’s timing (Bill Gross) and yet more believe it is the team. Asked another way, what do you think is essentially different about successful startups?
“If I had to pick one, I’d pick timing. But again, it could be explained as foresight or genius of the founder to launch the startup at a great moment in time.
“The most successful companies have a confluence of factors aligning to work in their favor. Take Facebook, for example. Mark Zuckerberg founded it at a time when everyone was getting online and broadband was becoming pervasive.
“In contrast, some really talented and hardworking founders just happen to work on the wrong things and don’t attain the same level of success. Some even tried Zuck’s idea but were too early. It often isn’t their fault. The timing just wasn’t right.”
Comments: Another investor perspective on timing.
“Mural raises $23M Series A after history of capital-efficient growth”
“Gaddy also answered the why now, and why so much question, saying that Mural is riding a ‘secular trend in terms of how people are going to produce creative work.’
“Mural is a tool that can be seen as a remote-work-friendly service. It’s also workplace collaboration software, putting it smack-dab in the middle of two current trends in Startuplandia.”
Comments: This is from a January 2020 article, just before Covid sent work to default remote. Mural benefitted both from the long-term trend and the sudden crisis change.
“VCs have to train themselves to ‘ask the stupid questions,’ says Hoxton Ventures’ Hussein Kanji”
“I think it’s actually perfectly fine in the venture industry to not be the smart person and to kind of train yourself to be stupid and ask the stupid questions,” said Kanji. “I think a lot of people are probably too shy to do that. And a lot of people [are] probably too risk averse to then write the check when they don’t really understand exactly what it is that they’re investing into. But a lot of this stuff is a light bulb moment.”
“One of those light bulb moments was Hoxton Ventures’ investment in Deliveroo, the takeout food delivery service that competes with Uber Eats and helped turn almost every restaurant into a food delivery service. However, Kanji reminded us that the European unicorn wasn’t the first company to try takeout delivery, but new technology, in the form of cheap smartphones coupled with GPS and routing algorithms, meant the timing was now right.
“‘People did try delivery,’ he said, ‘they tried it back in the 90s. Everyone forgets about that. There’s a company in New York City called Kozmo that would go off and like get you a pint of ice cream on demand. You know, it never worked because they used pagers. Like, do you remember pagers?… The breakthrough for delivery, and for that whole industry, was you had smartphones, you could give smartphones to the drivers, you could track what the driver was doing, which is good because then you could route logistics, you know, with a smartphone… light bulb moment.’”
Comments: A common timing example involving GPS-enabled smartphones.
“YC-Backed SpinPunch Aims To Build Faster, Prettier HTML5 Games”
“Mars Frontier is certainly an impressive game (albeit one that I sort of suck at), but I had to ask: why HTML5? Why now? Tien thinks the shift toward building more compelling browser-based gaming experiences is a matter of course, but doesn’t see too many players in the space really trying to push HTML5’s limits….
“It’s just a matter of time before the entire games industry moves to the browser, since the distibution [sic] advantage is so powerful,” Tien noted. Though the potential for tremendous reach is there, the shift isn’t going to happen overnight, but SpinPunch seems intent on riding the bleeding edge until it does.”
Comments: A new technology driver coupled with existing demand.
“Fin names former Twilio exec Evan Cummack as CEO, raises $20M”
“‘Service teams were forced to go remote overnight, and companies had little to no visibility into what people were doing working from home,” she added. “In this remote environment, we thought that Fin’s product was incredibly well-suited to address the challenges of managing a growing remote support team, and that over time, their unique data set of how people use various apps and tools to complete tasks can help business leaders improve the future of work for their team members. We believe that contact center agents going remote was inevitable even before COVID, but COVID was a huge accelerant and created a compelling ‘why now’ moment for Fin’s solution.’”
Comments: Crisis as an accelerant on what was going to happen anyway. Crisis sometimes operates differently and makes a change in outcomes, rather than just speeding them up.
“Q3 2020 is primed to be an intense shopping season for VCs”
“You have to include a “why now” slide and it should mention COVID-19.
“We already know that investors respond well to a Why Now slide. Our research shows that 54% of successful pitch decks included a Why Now slide, where only 38% of failed decks included it. That slide now has to work twice as hard. We’re hearing from investors that they expect to see information in your pitch deck about how your business has been affected by COVID-19 and how you plan to manage that impact moving forward. Even if the pandemic has had no material effect on your business, the investor will still have the question. Get out in front of it with a well-formed response near the beginning of your deck.”
Comments: Seems obvious now, but Covid became the big change of 2020. Everything was filtered through that crisis.
“Nest Team Descends On Nike Town To Recruit Fuel Band Engineers”
“Nest, the connected device company that was acquired by Google for $3.2 billion, apparently needs all the hardware engineers it can get. As the core hardware group within Google, Nest will be spearheading the development of new hardware products.
“That could mean phones, or tablets, or… wearables?
“So it’s probably not a surprise that members of the Nest team paid a visit to Beaverton, Ore. yesterday to have an informal meet-and-greet with folks who might have been part of the Nike Fuel Band team….
“Which is why now is a great time for other hardware companies to give them some options, by trying to recruit them.”
Comments: Good to move quickly when a crisis (the Nike lay-offs) combine with a lack of talent in a specific desired domain.
“Whistle While You Scroll, Or, How Facebook Could Conquer Music Videos”
“Suddenly, it seems like everyone wants to host music videos. Apple features them in Apple Music, both as suggestions of what to listen to and as posts from artists in the Connect tab. Spotify recently announced it would start showing video clips inside its app. New apps like Vessel are trying to court indie musicians and their videos with better revenue sharing. The labels still run their own hosting platform Vevo that often fueled by YouTube’s player. And YouTube is trying to monetize music videos more aggressively with its YouTube Music Key ad-free paid subscriptions.
“Why now? Mobile has come of age for video. Phones unlock the little five-minute wait times in our lives, and prime them for content consumption. Faster network connections, bigger screens, and more powerful processors all mean the videos load and look better. And advancements in mobile advertising make them monetizable.”
Comments: This article was written in 2015. Since then, Facebook did go much more heavily into video, but also faced competition from other video-first companies.
“How Can We Help? Announcing Signia’s 2nd Fund”
“The “Why Now?” helps us understand the market conditions that now make it possible for the potential investment to have global impact. We’re looking for cash-efficient disruption of large existing markets or the creation of new ones. Broadly speaking, we invest in technology companies that are taking advantage of mobility and data. Mobility to us means not just the rise of the smartphone as the dominant computing platform, but also new technologies such as Virtual Reality and Augmented Reality (VR/AR). Data doesn’t just mean Hadoop, it also means companies that are helping others take advantage of the huge surge in all different types of data being collected or delivered (from commerce to commuting to mobile video delivery). Many of the sectors we invest in are just starting to tap into their potential for huge impact, including transportation, fintech, commerce, VR/AR, big data, mobile SaaS, and AI. Check out the ideas section of our website for other areas we’re looking at.”
Comments: From 2016, this article focuses on the way an investor looks at timing.
Weak Why Nows
Having a timing advantage is not a guarantee of success. There are lots of ways to miss an opportunity. We also have to be sure that we don’t just cherry-pick the best examples.
But there are also lots of ways to invent a timing advantage when there are none. Is there anything in common when we see this happen?
“Source: Facebook Is Testing ‘Facebook At Work’, Separately Hosted Version To Roll Out In A Few Months”
“Enterprise social tools have existed for years. When I asked why now, the source told me it was simply because Facebook now had the infrastructure in place to support such a system”
Comments: The infrastructure rationale is weak. If Facebook didn’t have the infrastructure, would they built it for this product?
From “The Top 12 Reasons Startups Fail”
Starsky Robotics
“Timing, more than anything else, is what I think is to blame for our unfortunate fate. Our approach, I still believe, was the right one but the space was too overwhelmed with the unmet promise of AI to focus on a practical solution. As those breakthroughs failed to appear, the downpour of investor interest became a drizzle.”
Comments: In my other work on the timing topic, this is where we see the expectation of a process that seems to be improving on an exponential curve instead flattens into S-Curve. The needed improvements are still years away. Early companies shut down or burn cash seeking the improvements they need to bring their product to market.
Vreal
“VR platform Vreal intended to build a virtual reality space for video game streamers to hang out with their viewers and raised almost $12M in its 2018 Series A. However, the available hardware and bandwidth capabilities didn’t evolve as fast as the company had expected, and though it delivered on its promise, Vreal struggled to attract any significant usage:
“Unfortunately, the VR market never developed as quickly as we all had hoped, and we were definitely ahead of our time. As a result, Vreal is shutting down operations and our wonderful team members are moving on to other opportunities.”
Comments: I read this as mostly the result of a lack of demand. What could have given the team and investors this insight ahead of time?
Stockwell AI
“For some companies on our list, an unforeseen factor like the Covid-19 pandemic contributed to product untimeliness. AI-powered vending machine startup Stockwell AI shut down in July 2020 as consumers stayed at home and avoided surface contact. The company’s CEO Paul McDonald wrote in an email to TechCrunch,
“’Regretfully, the current landscape has created a situation in which we can no longer continue our operations and will be winding down the company on July 1st. We are deeply grateful to our talented team, incredible partners and investors, and our amazing shoppers that made this possible. While this wasn’t the way we wanted to end this journey, we are confident that our vision of bringing the store to where people live, work and play will live on through other amazing companies, products and services.’”
Comments: The crisis driver of timing makes quick changes. If a business is coincidentally positioned to take advantage of a crisis or if they can act fast, they can win. If not, as with Stockwell AI, they run out of time and fail.
Read here (all of the above section)
“Clubhouse’s Inevitability”
“Much of what I’ve written is perhaps obvious; to me that lends credence to the idea that Clubhouse is onto something substantial. To that end, though, why now?
“One reason is hardware:
“Clubhouse is the first AirPods social network.
“The fact that Clubhouse makes it so easy to drop in and out of conversation is matched by how easy AirPods make it to drop into and out of audio-listening mode.
“An even more important reason, though, is probably COVID. Clubhouse launched last April in the midst of a worldwide lockdown, and despite its very rough state it provided a place for people to socialize when there were few other options. This was likely crucial in helping Clubhouse achieve its initial breakthrough. At the same time, just because COVID helped Clubhouse get off the ground does not mean its end will herald the end of the audio service, any more than improved iPhone cameras heralded the end of Instagram simply because its filters were no longer necessary; the question is if the crisis was sufficient to bootstrap the network.”
Comments: This reasoning was incomplete. True, the COVID crisis did create an opening for a new behavior, but people eventually became tired of it. The market window opened and then shut out of apathy. As market windows shut for social/behavioral timing drivers, there are those that represent long-term change (new sustainable addictions) and those that don’t result in enduring behavioral change. But I’m biased on this one as well, since the first iteration of an old startup of mine was a Clubhouse precursor — in a 2G world. The iPhone camera to Instagram comparison also needs to acknowledge that people stay on networks even when the initial technology advantage (the filters in that case) are no longer a differentiator.
“For Media And Gaming, Virtual Reality Is The Wolf Standing Just Outside The Door”
“[W]e’ve heard the enthusiastic cries for VR for decades. Is it for real this time?
“For the last 20 years VR has been just around the corner, but there have been three major hurdles in the way to mainstream adoption. Today, all three hurdles have been removed.
Price: “With free systems on the low-end, and a 10x reduction on the high-end, the price hurdle has finally been bested.”
Content: “The number of VR projects doubled year-over-year at this year’s E3 2015, rising to 30 new projects or titles. Every trend points to content gaining momentum. The content hurdle has also been crossed.”
Fragmentation for production and distribution: “Unity has tackled this problem head-on with their platform production tools for VR. The app stores for iOS and Android have solved the distribution problem on the low-end, and each high-end manufacturer is racing to establish themselves as a high-end, Valve-like distribution channel.”
Comments: The adoption of VR has so far been much lower than expected. The argument in the article from 2015 quoted above is one of the most important I’ve listed. We can see that simply checking off items needed to make a business work technically is not enough. With the hurdles to mainstream adoption removed (as claimed), why did VR not grow?
To compare what actually happened, here’s the Google Trends graph of interest in YouTube 360 Video, starting from the date the article was written.

Note also that the article’s author is Roelof Botha. This is the same investor who so presciently assessed YouTube’s potential in 2005.
Here’s the list of other Why Now posts. If you like these, check out the Why Now book.
- “Why Now: Timing and Product Success”
- “Avoid the Analysis of Others (Why Now)”
- “Running a ‘Why Now’ Session”
- “50 Timing Examples (the Why Now question)”
- “Measuring Your Market? Consider Timing.”
- “What People Miss About Timing”
- “What Others Say About Timing”
- “The ‘Cold Market’ as the Next Hot Market”